Learn how to plan a temperature project to make weather-inspired art!
Crafting can be so much more than making something pretty. Imagine blending data and artistry into a keepsake that’s both beautiful and meaningful. With each color representing a temperature range, temperature tracking projects are a delightful way to capture the passage of time. But how do you plan a temperature tracking project and stay motivated for a long term endeavor? I’ll show you how!
Watch the full step-by-step video tutorial on how to plan a temperature project:

January 2026 Update: I finished my 2025 temperature tracking project! Scroll down to see how it turned out!
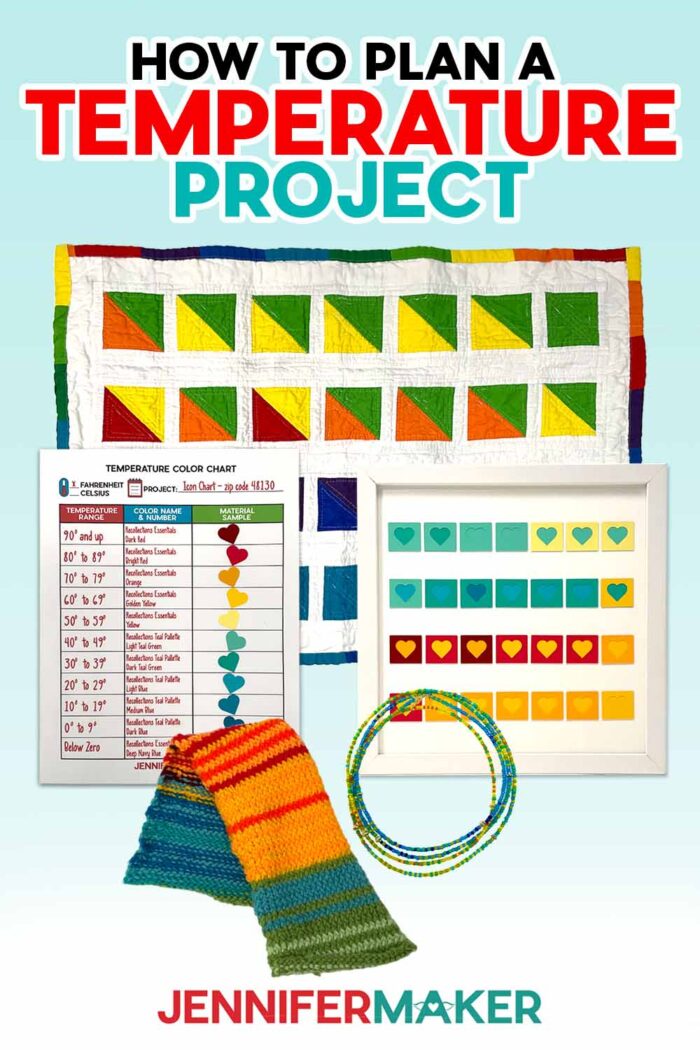
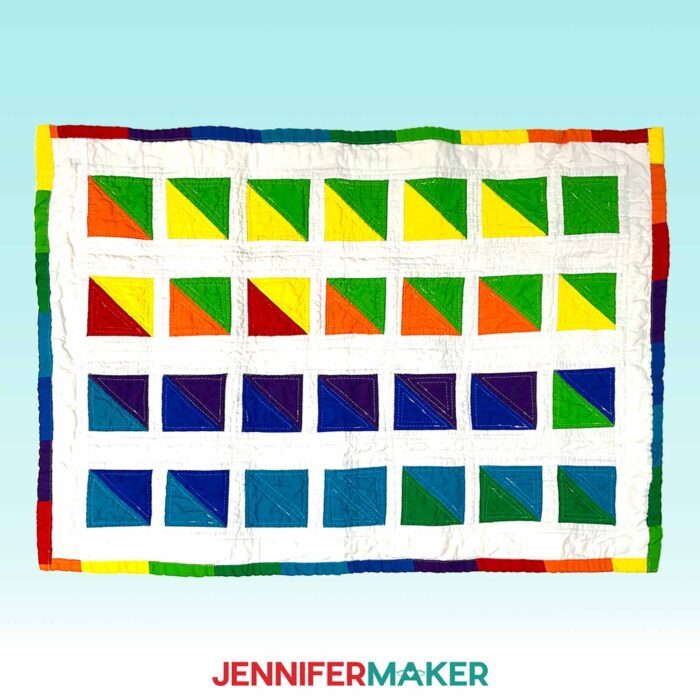
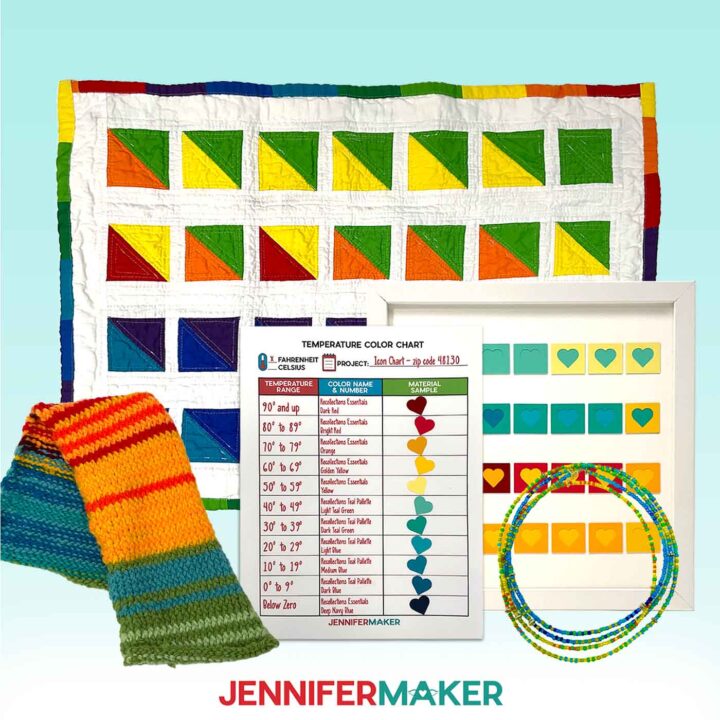
Tracking projects are a fun crafting pastime, with crafters incorporating data from mood journals, reading trends, and temperatures into physical projects in colorful and creative ways. I’ve seen crafts as simple as a beaded necklace or as elaborate as a large quilted temperature blanket project. Whichever craft you choose, it will require planning and commitment — but the result is a meaningful keepsake of the year you’ve lived. I’m making my own temperature tracking project this year, and I would love it if you’d join me!
By the end of the year, you’ll have a unique and colorful creation that reflects the changes in temperature, day by day. Whether you’re making knitted temperature blankets, a piece of jewelry, or a piece of dynamic wall art, the possibilities are endless – as long as you plan well.
Careful planning is the key to a successful result – and that’s where my free color planning and temperature tracking charts come into play! The charts will work with any type of project you want to create, whether it’s a simple paper project or an entire blanket!
Why is planning so important? If you represent one data point each day, that’s 365 pieces of data each year. If you represent two data points each day of the year (like a high and a low temperature), that’s 730 pieces of information! Be sure to choose a project that works with the number of data points you’ll have at the end of the year, otherwise you might end up with a finished result that’s bigger or smaller than you imagined.
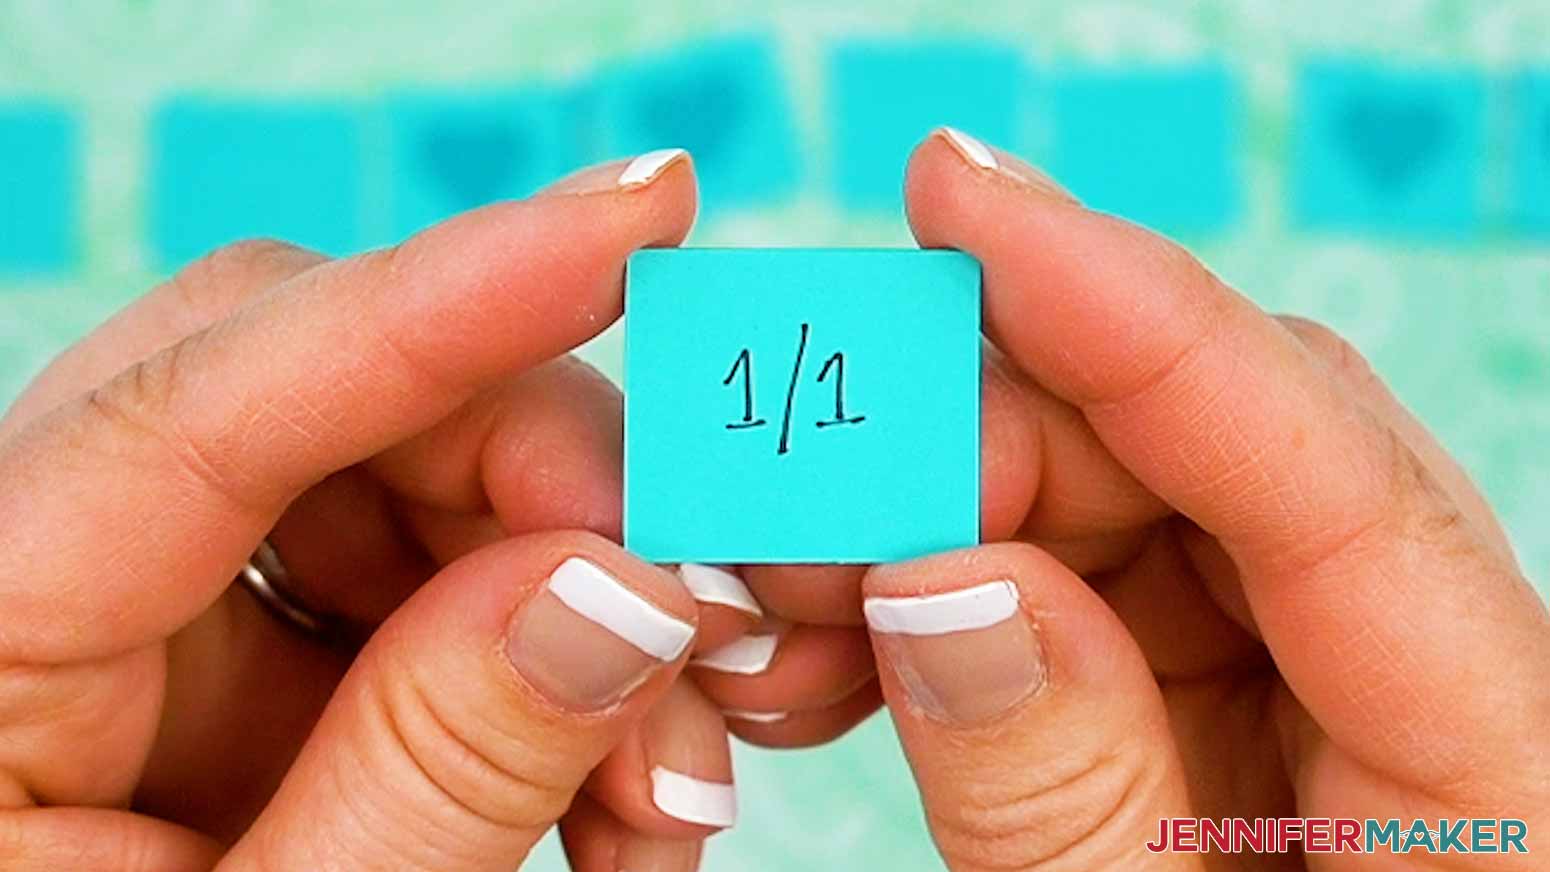
Starting on January 1st, begin tracking the daily temperature in your local area on your Temperature Tracking Chart. You can track it every day using your own temperature gauge, or find historical weather data online to fill out your temperature charts periodically. On the chart, there are spots to record the high temperature, low temperature, and notes for each day. Each page holds ten days worth of data, so print the right number of charts for your project.
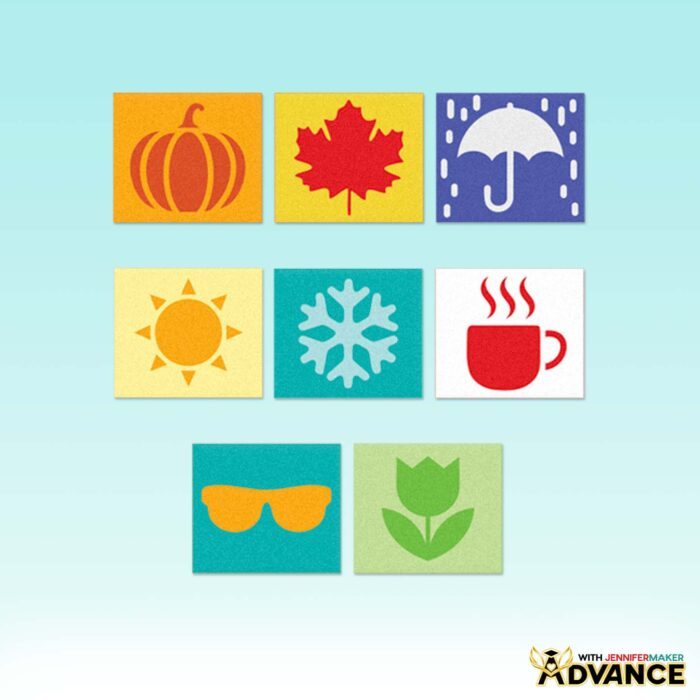
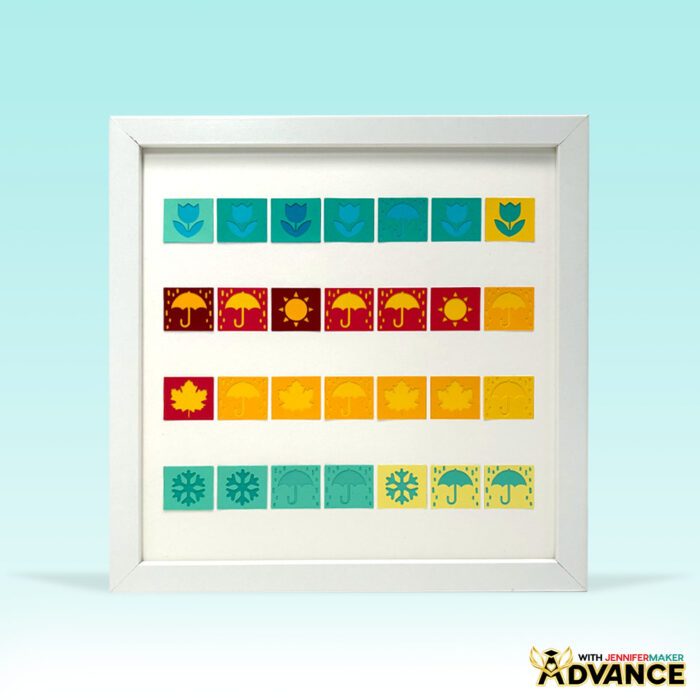
You can also track the average temperature, precipitation, wind speed, humidity, or even the moon phases instead, or work that extra data into your temperature project. On a quilt, you could add special stitches or symbols to mark significant weather days or use different fabric patterns for certain data. On a cardstock tracking project like my framed paper quilt, you can use pieces with different symbols to represent the variations in weather – like those you’ll find in my toolkit if you’re an Advance member!
One of the most fun parts of planning your temperature project is creating your color chart. Most tracking projects like this use different colors to represent each range of temperatures, so pick a craft that will let you show off several different color options. That could be a rainbow of markers or pens for drawn projects, multiple yarn colorways for knit and crochet projects, beads for jewelry, fabric for quilting, or cardstock like I’ll use on my framed “paper quilt” wall art project.

Next, it’s time to pick your colors and assign them to specific degree ranges. I’ll show you how to decide what kind of degree increments to use for your project to maximize your color variations! You can go with a classic rainbow color palette for a cheerful look, or customize your color schemes to include your favorite colors. Colder temperatures might shine in soft blue and purple color ranges, while warm colors like sunny yellows, oranges, and reds could represent days with higher temps. Or, go totally random with your color choices and see how the project comes together in its own unique way!
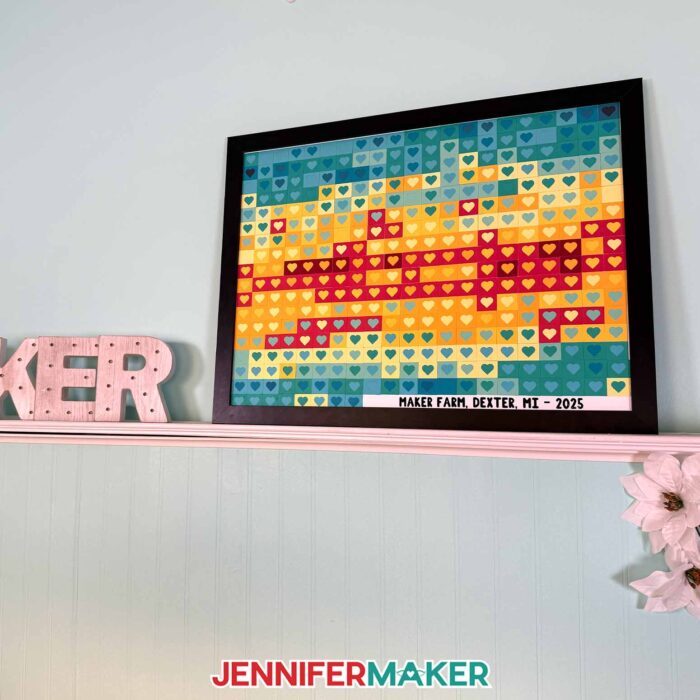
I’ll use layered cardstock hearts to represent each day’s high and low temperature data at Maker Farm, then line them all up on a framed artboard for a pretty piece of wall art that looks like a paper quilt! If you want to try this type of temperature project, I’ll show you how to make your own in my video tutorial.

You can use the empty space at the end of the full year to add a color key, the year, or a quote using adhesive vinyl! To learn more about applying adhesive vinyl to flat surfaces like an art board, check out my tutorial on How to Use Transfer Tape.
As you track the daily temperature changes, your project will grow and evolve. You’ll get to see it come to life, row by row, bead by bead, or square by square! I bet you’ll love watching patterns and trends emerge as you go! By the end of the year, you’ll have a stunning visual story of the entire year’s weather. It’s a wonderful way to reflect on the days as they pass and celebrate the rhythms of nature through a creative process!
Would you like to plan a temperature project with fewer days worth of data AND more square designs to represent weather, seasons, and special days? I have a workshop just for you in my ADVANCE program. Learn more about ADVANCE with JenniferMaker here!
A temperature project is more than just a fun way to track the year—it’s an opportunity to explore color combinations, commemorate everyday moments, and craft a one-of-a-kind piece of art. So grab your materials, watch my tutorial to learn my best tracking tips, and let’s start a year-long project together. I can’t wait to see your colorful creations take shape!
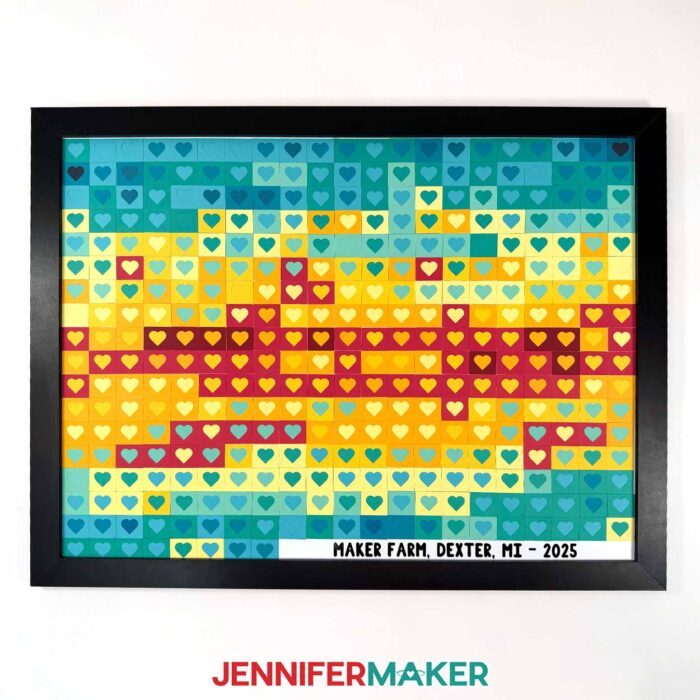
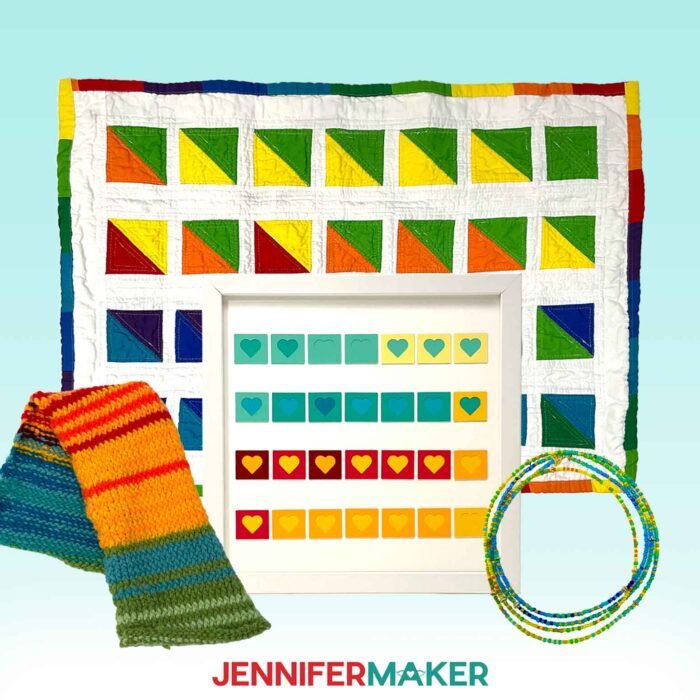
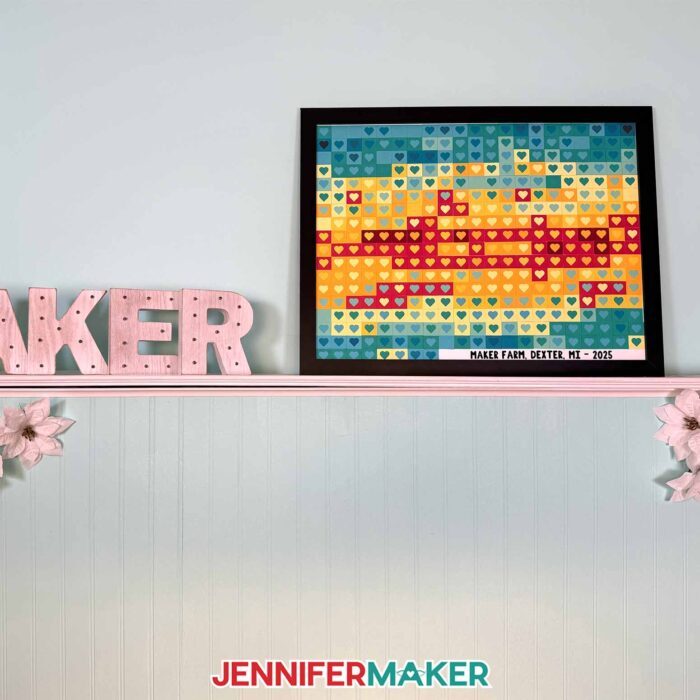
Here’s how my year-long temperature tracking project from Maker Farm turned out!
Let me show you how to plan a temperature project! This post contains some affiliate links for your convenience (which means if you make a purchase after clicking a link I will earn a small commission but it won’t cost you a penny more, there is no additional cost)! Read my full disclosure policy.
Materials to Make a Paper Quilt Temperature Tracking Project
View my Amazon shopping list for the exact items I used!
- 18″ x 24″ Artboard
- 18” x 24” Frame (alternative option) (optional)
- 12″ x 12″ 65 lb. Recollections Cardstock Essentials Pack (a variety of colors)
- 12” x 12” 65 lb. Recollections Cardstock Teal Palette
- A way to cut your materials – I’m using the Cricut Maker 3, but you can also use the Cricut Maker, a Cricut Explore Series machine, the Cricut Venture, or even the Cricut Joy Xtra or the original Cricut Joy
- Cricut Green StandardGrip Machine Mat 12″ x 12”
- Scissors
- Scraper
- Brayer
- Measuring Tape
- Craft Glue (I used Bearly Art Precision Craft Glue)
- Isopropyl Alcohol (optional for cleaning the glass in the frame) -AND-
- Lint-Free Cloth (optional for cleaning the glass in the frame)
- Ink Jet Printer -AND-
- 8.5” x 11” Copy Paper (optional if printing the planning charts)
- Pen or Pencil (optional if printing the planning charts)
- Three-Hole Punch -AND-
- 1” 3-Ring Binder (optional to hold your tracking charts)
How to Plan a Temperature Project!
Plan a Temperature Project
Learn how to plan a temperature project to track daily temperatures and update it throughout the year!
Materials
- 18" x 24" Artboard -AND-
- 18” x 24” Frame (optional) -OR-
- 18" x 24" Frame (alternative option) (optional)
- 12" x 12" 65 lb. Recollections Cardstock Essentials Pack (a variety of colors)
- 12” x 12” 65 lb. Recollections Cardstock Teal Palette
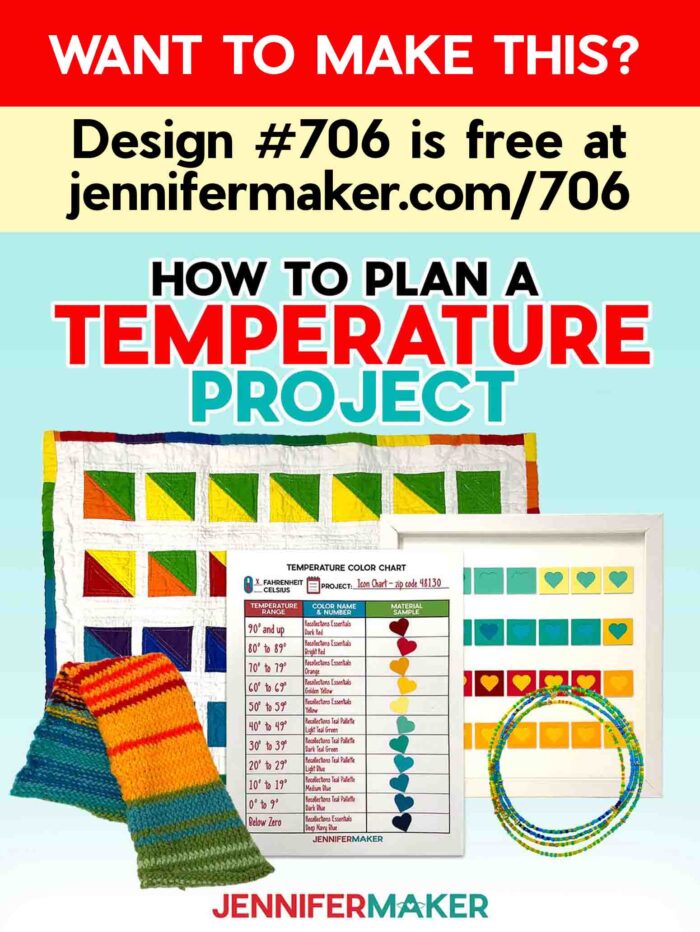
- Design #706 (My free SVG/DXF/PDF design files are available in my free resource library - get the password by filling out the form at the bottom of this page)
Tools
- A way to cut your materials - I’m using the Cricut Maker 3, but you can also use the Cricut Maker, a Cricut Explore Series machine, the Cricut Venture, the Cricut Joy, or the Cricut Joy Xtra
- Cricut Green StandardGrip Machine Mat 12" x 12"
- Brayer
- Measuring Tape
- Craft Glue (I used Bearly Art Precision Craft Glue)
- OPTIONAL: Inkjet Printer -AND-
- OPTIONAL: 8.5” x 11” Copy Paper (if printing the planning charts)
- OPTIONAL: Pen -OR-
- OPTIONAL: Pencil (if printing the planning charts)
- OPTIONAL: Three-Hole Punch -AND-
- OPTIONAL: 1” Three-Ring Binder (optional to hold your tracking charts)
Instructions
STEP 1: GET MY FREE TOOLS TO PLAN A TEMPERATURE PROJECT
First, download my temperature project designs from my free library – look for Design #706. Alternatively, you can use the Save This Project from near the top of this post and the design link will be emailed to you.
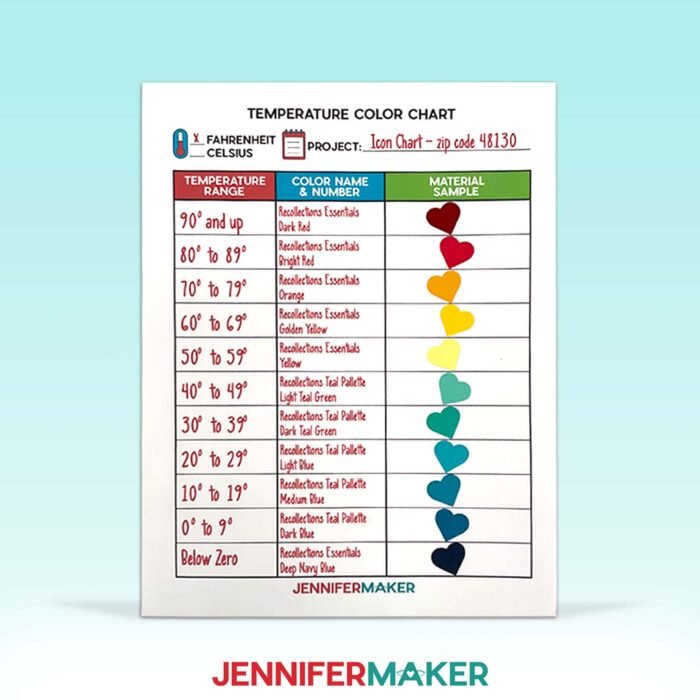
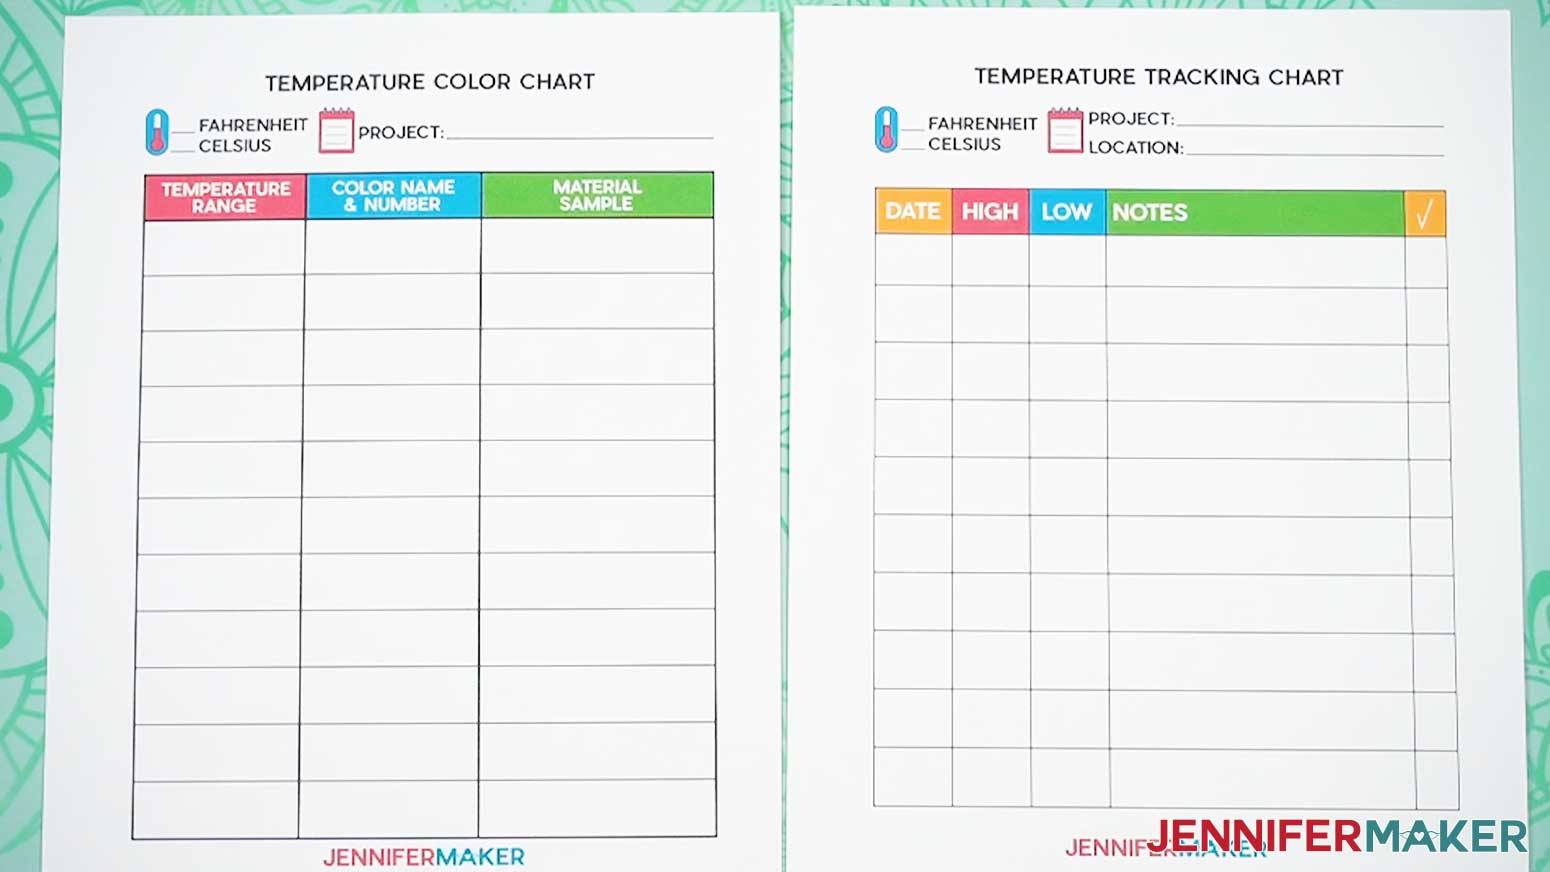
The PDF folder contains a Temperature Color Chart and Temperature Tracking Chart, which you can use to help plan your project.
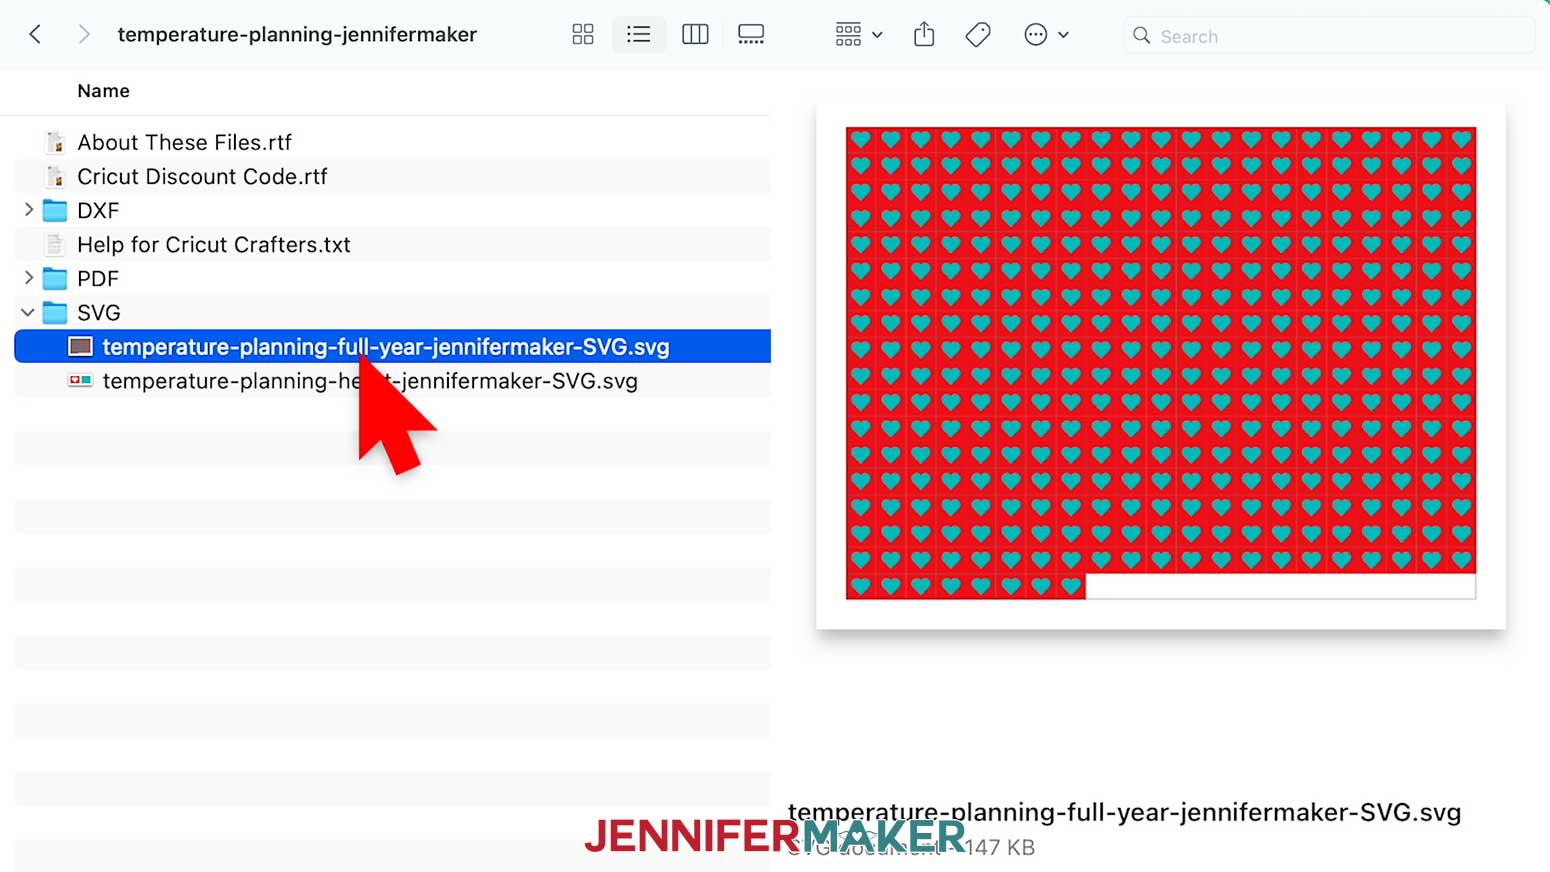
The SVG folder contains a 365 square grid to make a year-long cardstock temperature tracking quilt.
TIP: If you’re not sure how to download zip files and upload designs, go to jennifermaker.com/svgs.
STEP 2: PRINT OR OPEN YOUR CHARTS IN A PDF EDITOR
- Open the PDF folder in my free download.
- Open the Temperature Color Chart PDF (the one with “color-chart” in the file name).
- Use the form digitally by inputting the data in a PDF editor like Adobe Acrobat, or print it from a program that can open PDF files like Adobe Acrobat or Adobe Acrobat Reader.
NOTE: I recommend printing the color chart because you can attach a material sample of the medium you’re using (cardstock, fabric, yarn, embroidery floss, etc.). - To print from Adobe Acrobat Reader, click “File” then “Print,” or click the Print icon at the top of the screen.
- Make sure your inkjet printer is selected from the dropdown menu.
- Adjust your printer settings if desired. I used the default settings for my inkjet printer.
- Click “Print.”
- Open the Temperature Tracking Chart PDF (the file with “track-temp” in the name) in a PDF editor like Adobe Acrobat to input the data digitally, or repeat steps 4-7 to print the chart using Adobe Acrobat Reader.

STEP 3: PLAN YOUR TEMPERATURE COLOR CHART
- Before you start your project, grab or open your Temperature Color Chart. If you printed it, also grab a pen or pencil and your project materials.
- At the top, choose whether you’ll use Fahrenheit or Celsius temperatures for your project and write a checkmark next to that measurement.
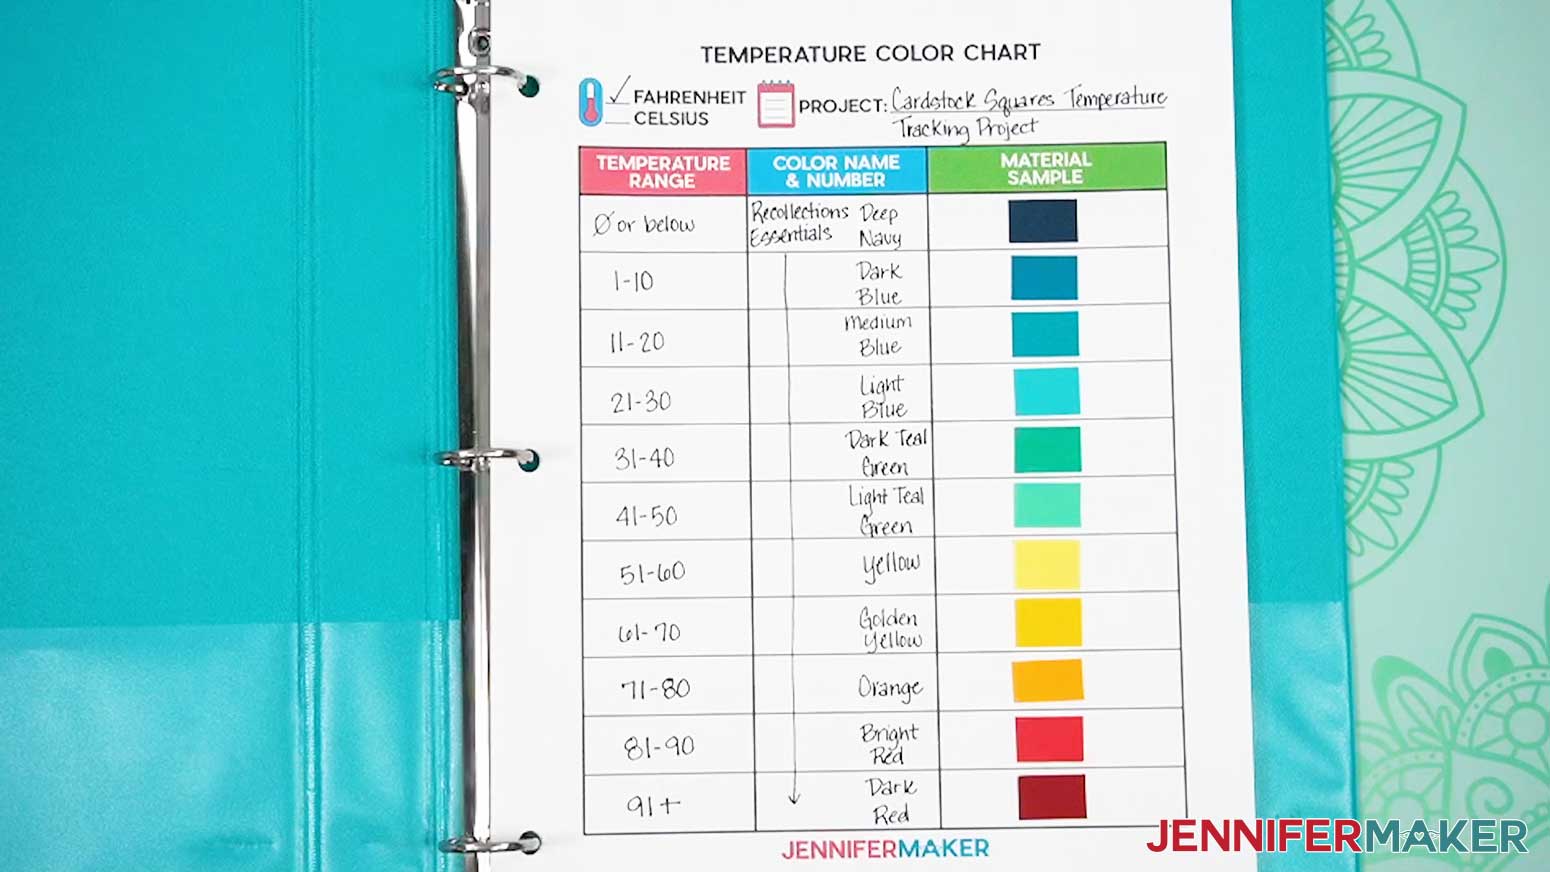
- Where it says “Project,” write which project you’ll be using these materials for. This is especially important and helpful if you’re making multiple temperature tracking projects. Since I’m using cardstock for mine, I’ll write “Cardstock Squares Temperature Tracking Project by JenniferMaker.”
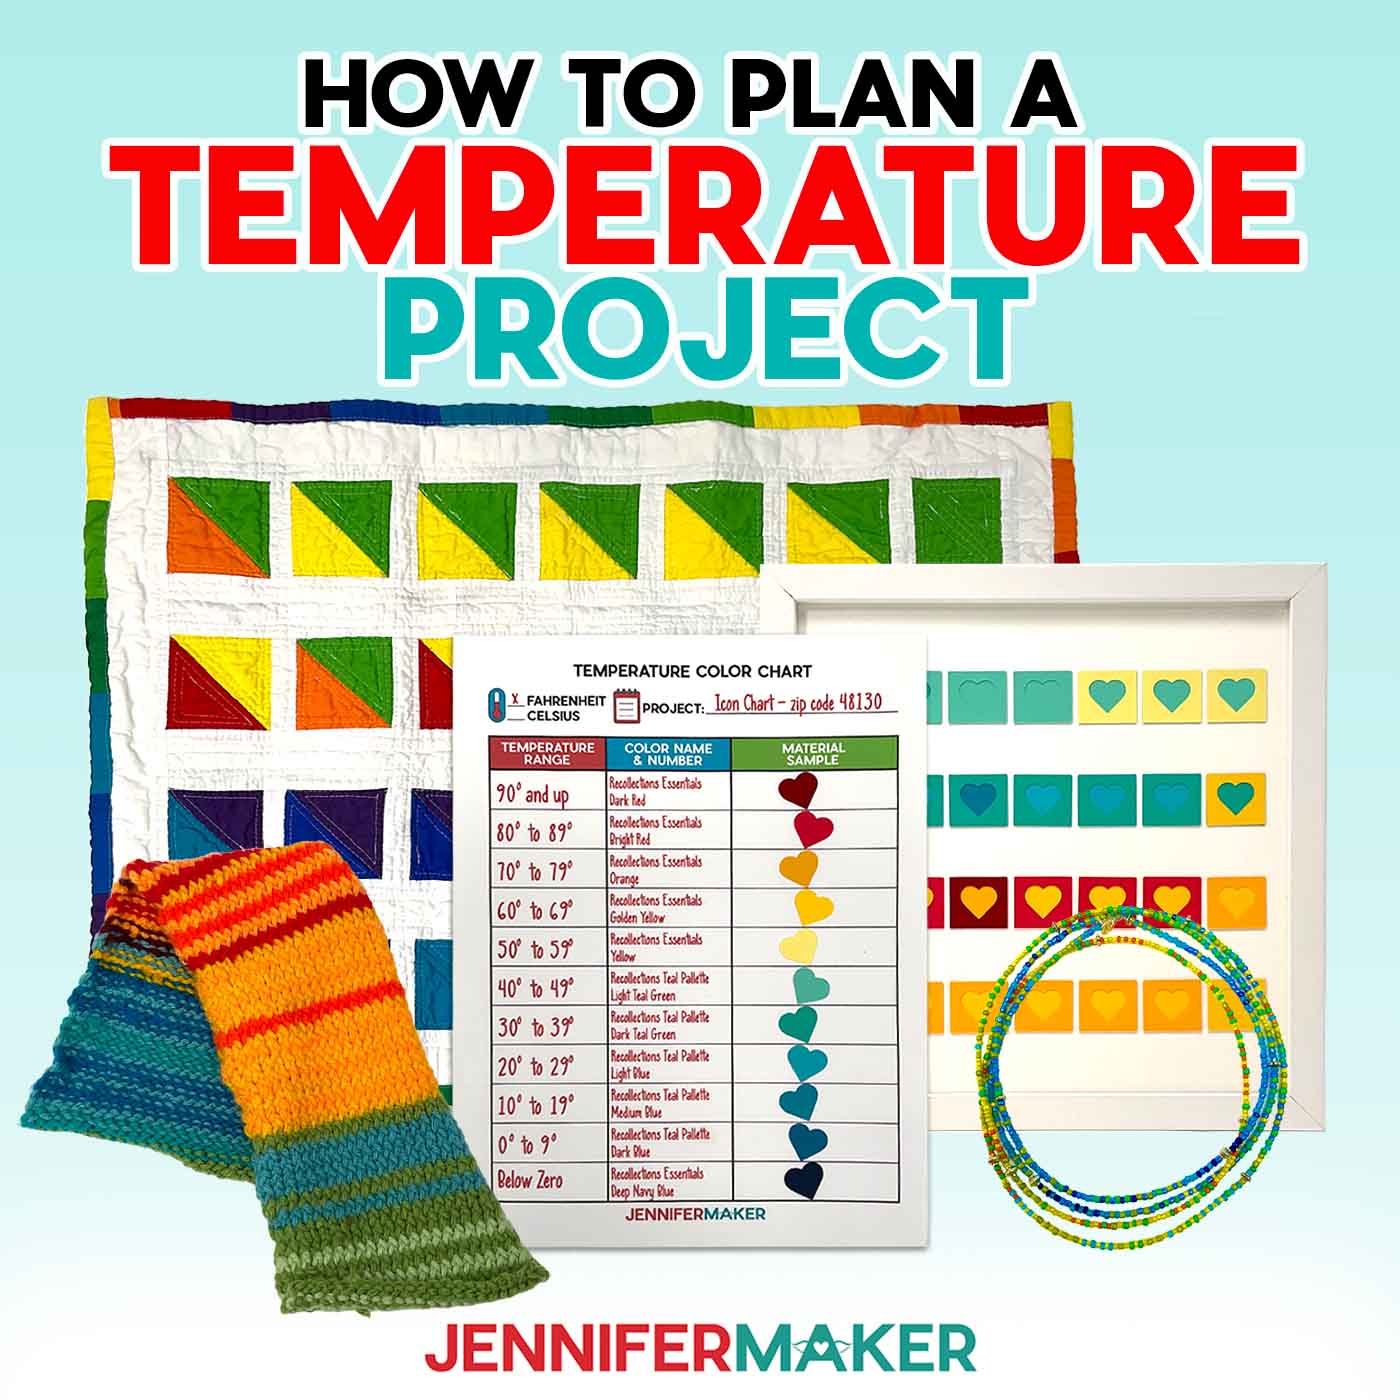
- Decide which temperature ranges you’d like to track, and write them in the column titled “Temperature Range.” Since I chose 10 degree increments, I wrote “0 or below” in the first field, “1-10” in the next field, “11-20” in the next, and so on.
NOTE: I designed my chart using 10-degree increments so I only have to choose a max of 10-11 colors of materials – or fewer, depending on where you live!
TIP: If you live in an area where there are milder temperature fluctuations, plan your temperature ranges to be 5-degree increments to ensure more color variation in your project. If you have 12 or more different colors, be sure to print multiple copies of the chart. - In the “Color Name & Number” column, find or assign the color name and/or number for each material that you’ll use to represent each temperature range.
NOTE: I used dark red cardstock for my “91+” temperature range on my paper quilt, so I wrote “Recollections Essentials Dark Red.” This is especially helpful and important if you’re using different brands with the same color names, or different shades of the same color. - If you printed your chart, in the “Material Sample” column, you can glue or tape a small sample of the material that matches what you wrote in the “Color Name & Number” field.
STEP 4: GET AND TRACK YOUR TEMPERATURE DATA
- Grab or open your Temperature Tracking Chart. If you printed it, also grab a pen or pencil.
- Write a checkmark next to “Fahrenheit” or “Celsius” depending on which measurement you’re using for this project.
- Where it says “Project,” write which project you’ll be using these materials for. This is especially important and helpful if you’re making multiple temperature tracking projects.
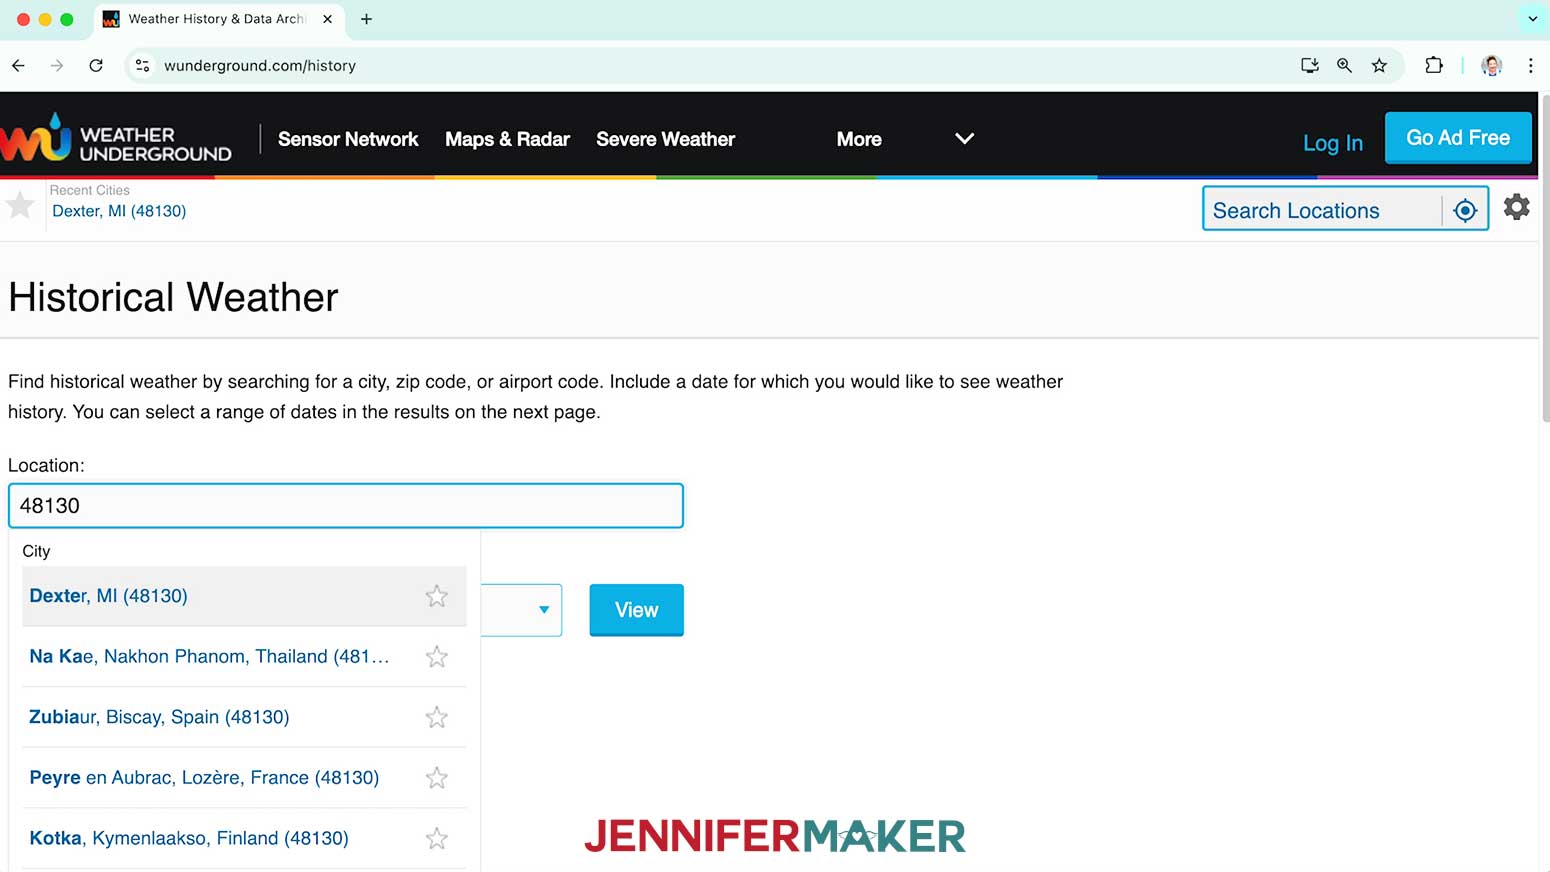
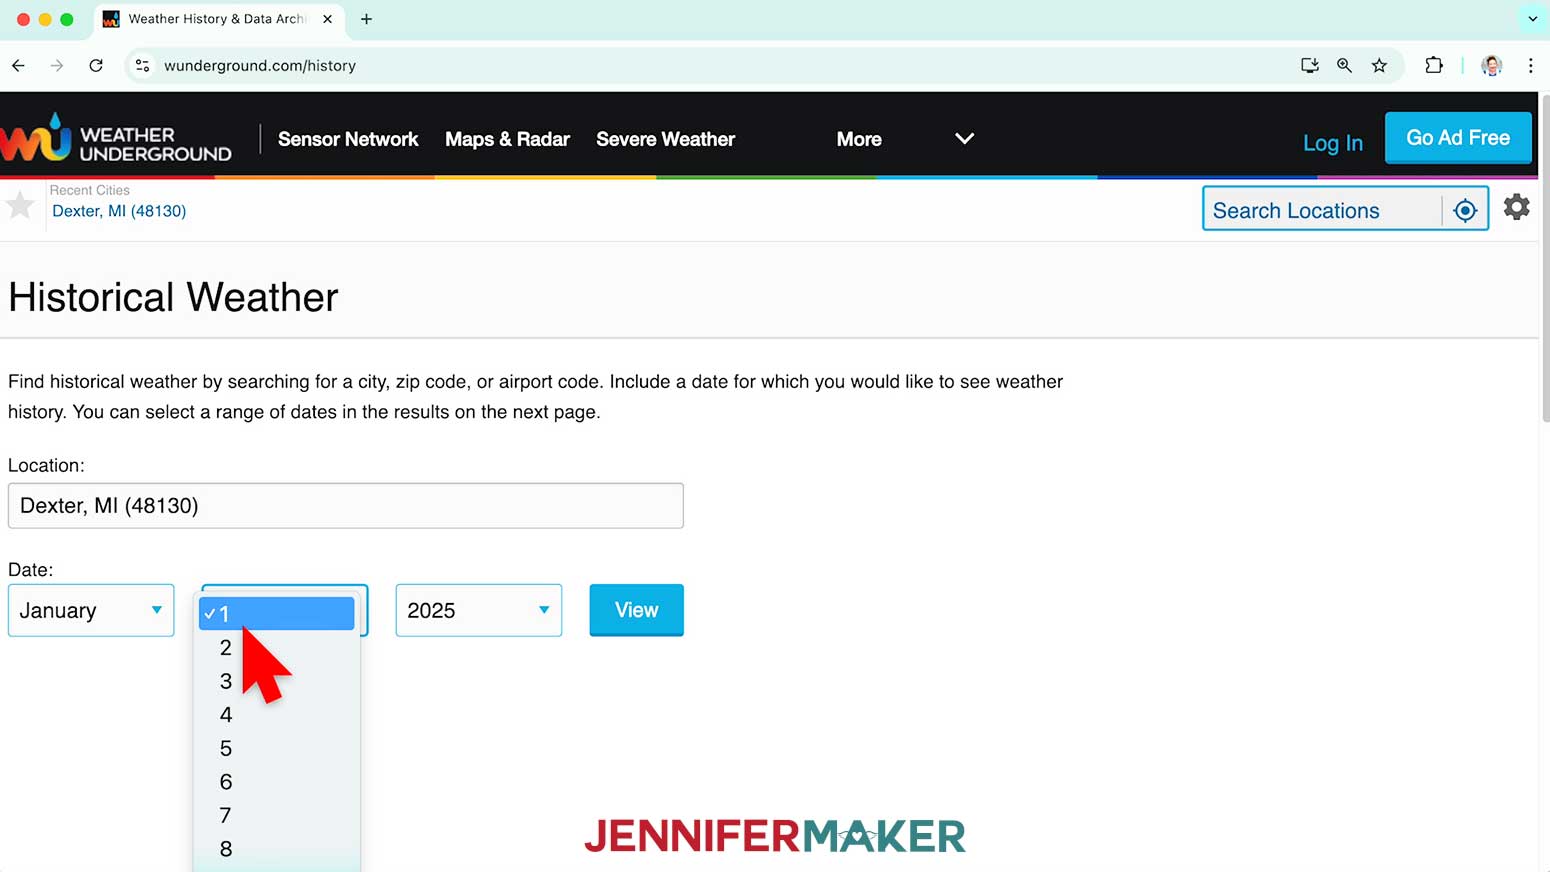
- Go to wunderground.com/history in your web browser.
- Type in your ZIP code into the “Location” field.
- In the drop-down menus, select the date that you’d like temperature data for.
- Click “View.”
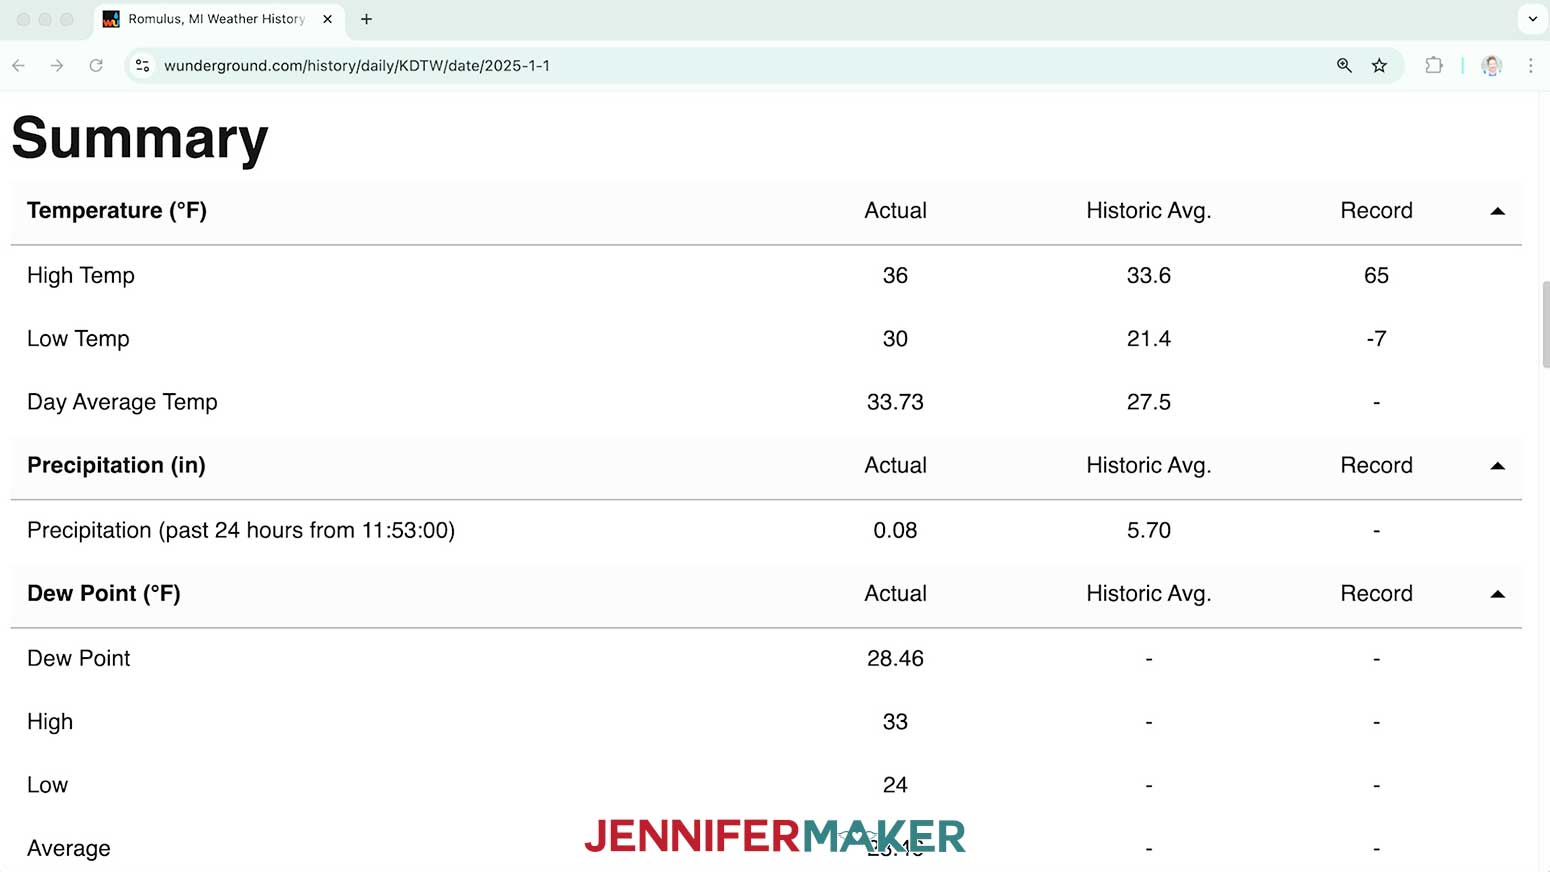
NOTE: The city at the top of the page may not be your city. That’s because weather data is typically gathered from stations at airports, and is representative of your general location. For example, I entered the ZIP code for Dexter, Michigan and the result was temperature data from the airport in nearby Romulus, Michigan. If you’d like to use the weather data from a different city, click “Change” next to the station name at the top, and select a new option from other nearby professional and personal weather stations. - Scroll down to where it says “Summary,” and the High Temp and Low Temp will be listed for that date.
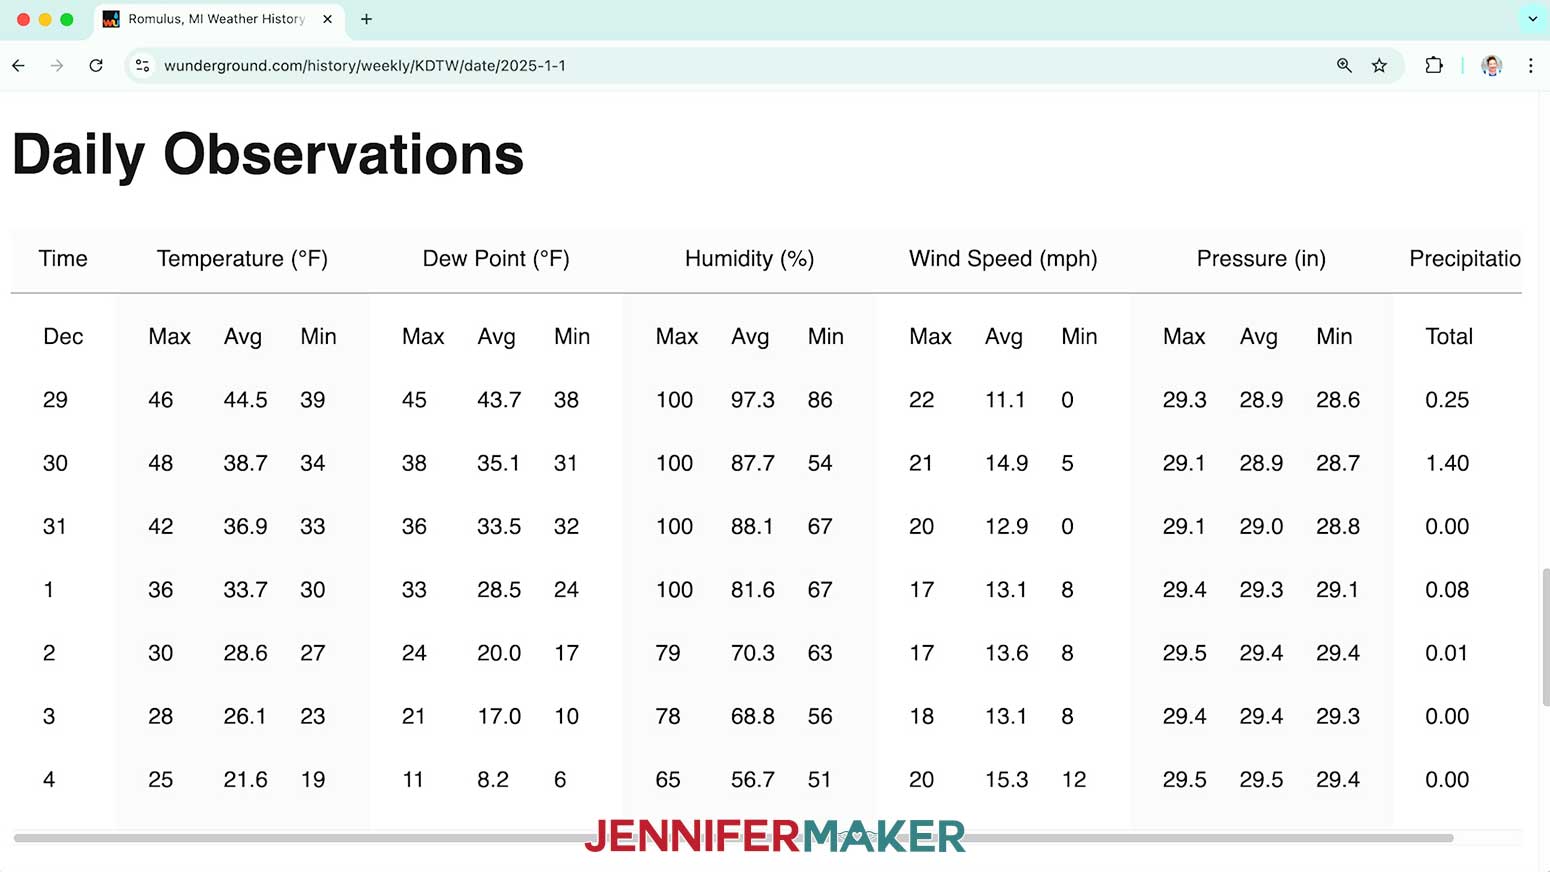
- To get data for multiple days at a time, click “Weekly” or “Monthly” at the top of the data, then scroll down to see “Daily Observations.”
NOTE: In the “Weekly” and “Monthly” views, the high temperature is called the “Max” and the low temperature is called the “Min.” - Record the data you need on your Temperature Tracking Chart.
STEP 5: PREPARE AND CUT YOUR PAPER QUILT PIECES
NOTE: First, measure the surface to which you will attach your cardstock squares. If you'll display your finished project in a frame, measure the inside frame dimensions from the front.
CRICUT DESIGN SPACE
Your year-long temperature tracking project will reflect data for 365 days of the year. This is a LOT of data, so planning is important!
NOTE: When each of the 365 days of squares have been attached to the board, you will be left with some empty spots at the end. You can fill the space however you like, with a color key, the year, or something else.
- In Cricut Design Space on a blank Canvas, click “Upload.”
- Click “Upload Image.”
- Click “Browse.”
- Select the SVG you want to use.
NOTE: Inside the SVG folder, there is a “full-year” file and a “heart” file. If you’re just starting your paper quilt temperature project, use the file with “full-year” in the name. - Click “Open” and then “Continue.”
- Click “Upload” to add the design to your Canvas.
- Ungroup the design.
NOTE: On each square, one layer will represent the High temperature and the other layer will represent the Low temperature for one day. You can choose which piece represents the High or Low – just make sure they stay consistent throughout the whole board! I used the bottom piece for the Low temperatures and the top piece with the heart cutout for the High temperatures. - Click “Save” and give your project a name.
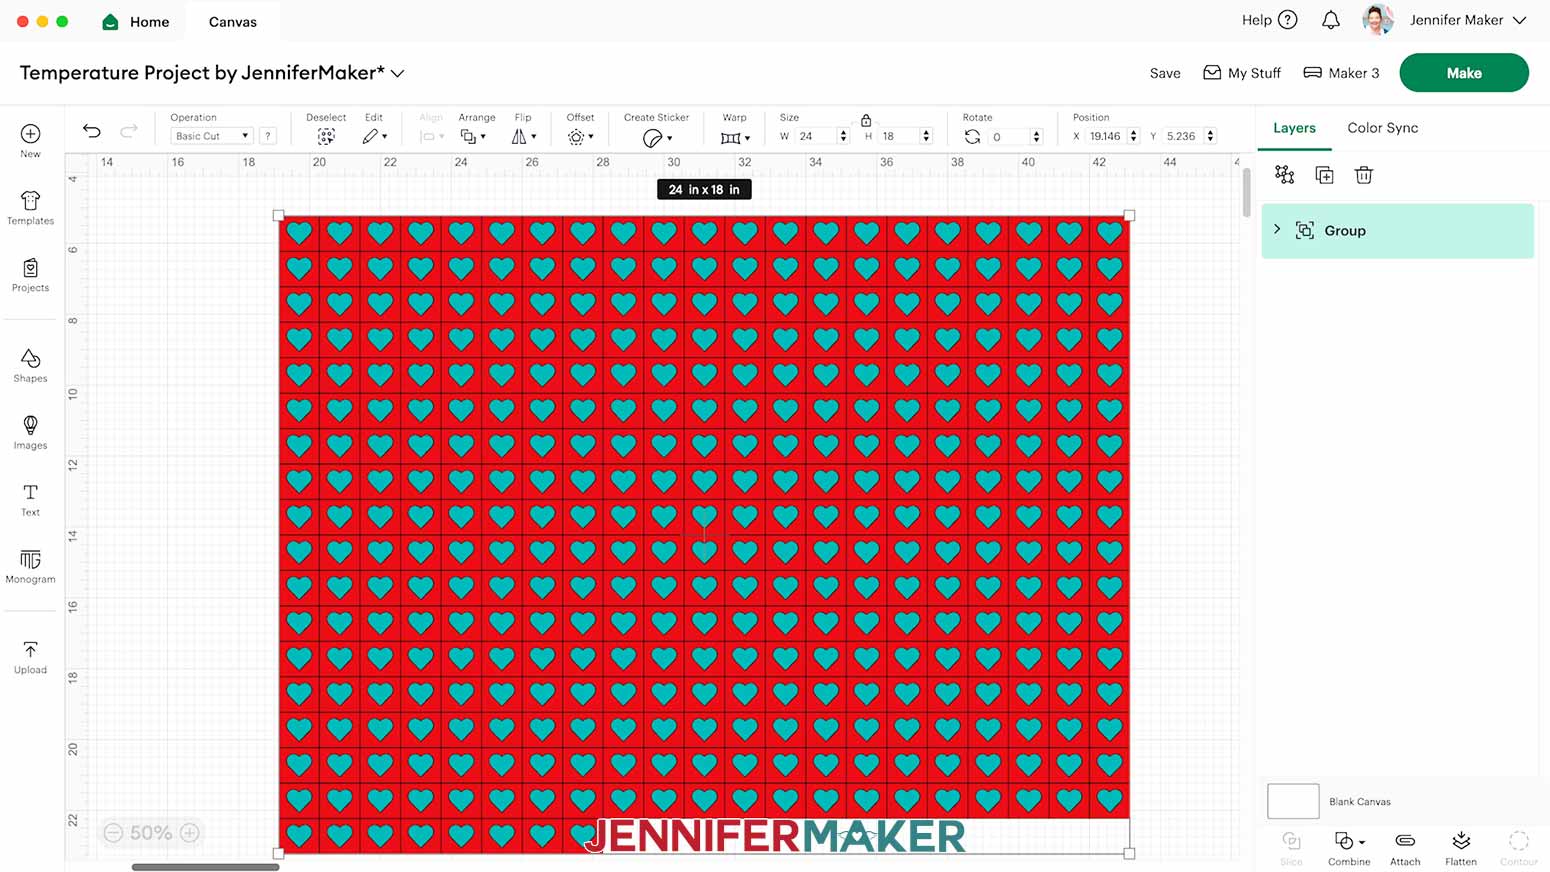
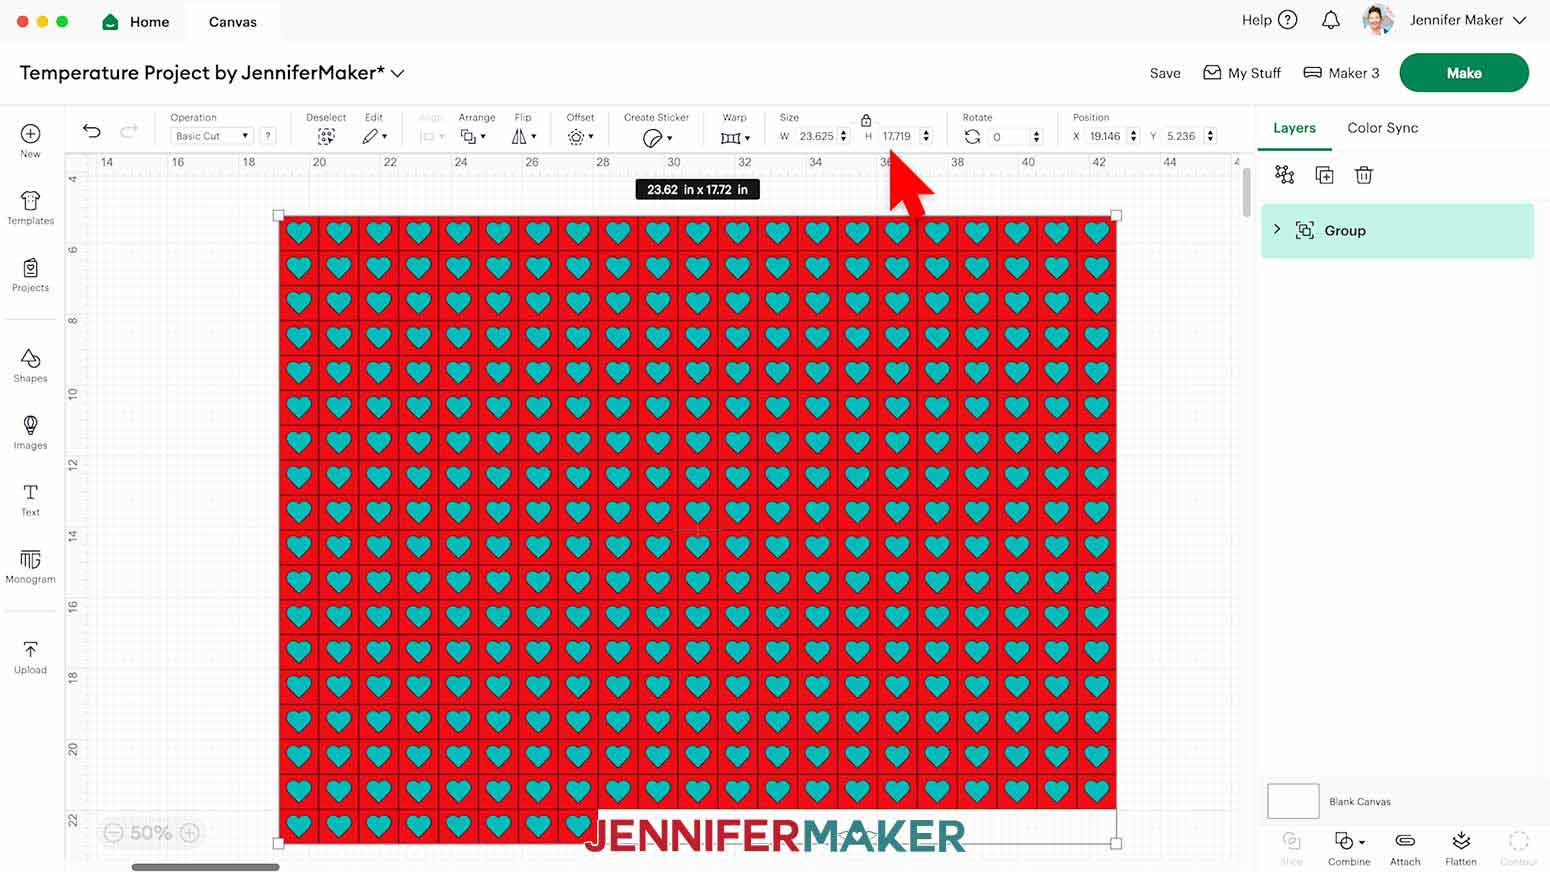
- Select the entire full-year design and resize it to match the dimensions you measured on the surface to which you'll attach your squares. Keep the lock icon closed to maintain proportions.
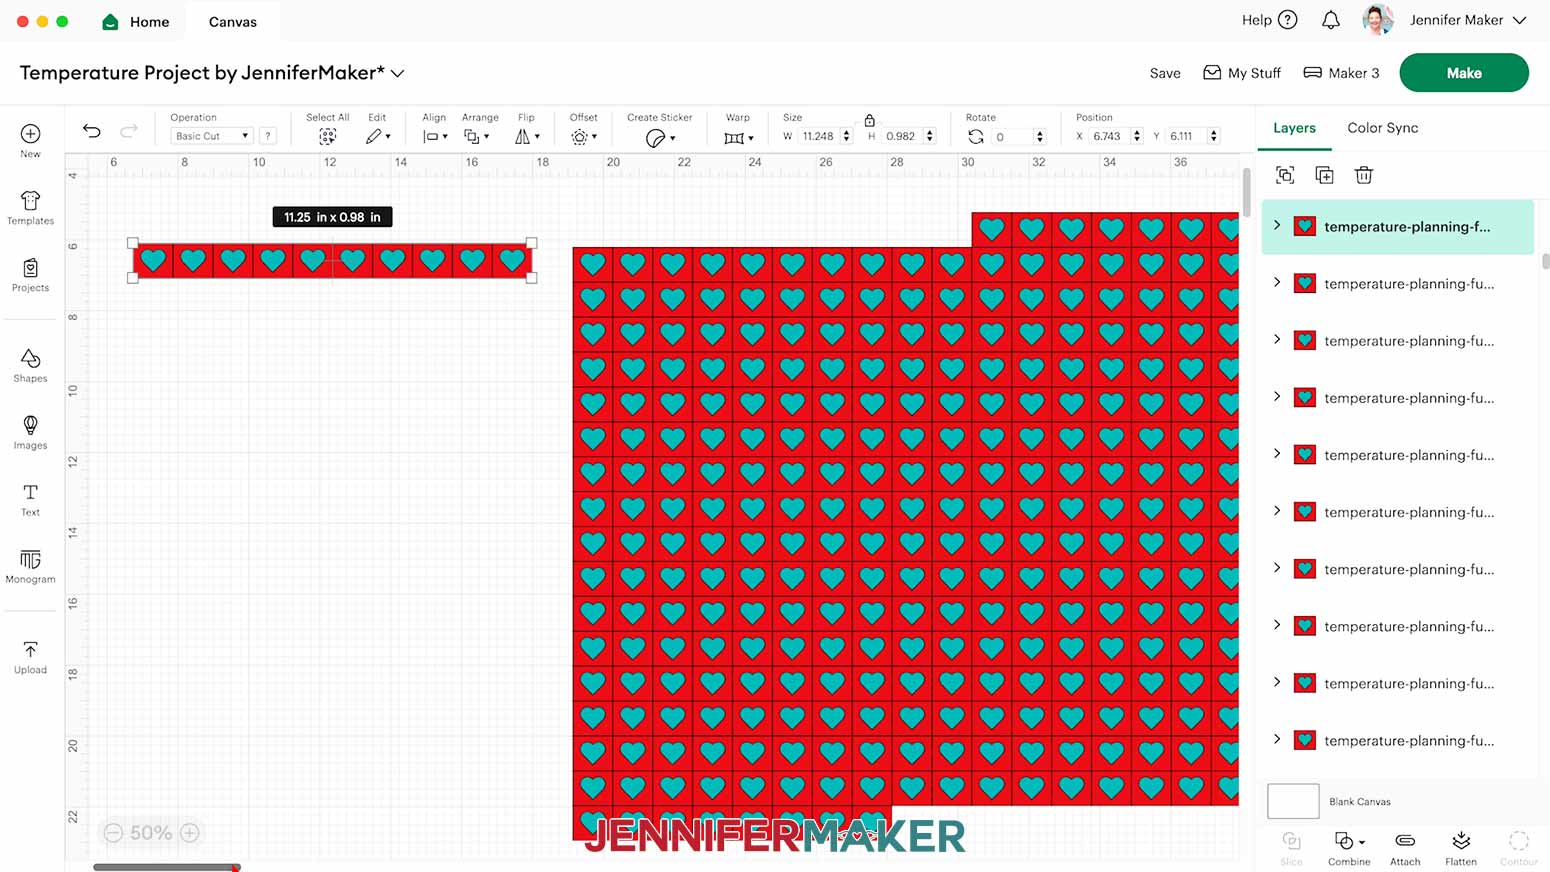
NOTE: The dimensions of your full-year grid design on your Canvas should be as close as equal to the inner dimensions of the front opening of your frame. My frame's front opening measured about 23.625" x 17.625". I entered "23.625" in the "Width (W)" field, which resized the height to 17.719", which is almost exactly the size of the frame opening. - Look at your Temperature Tracking Chart and determine how many days worth of squares you need to cut. I recommend cutting squares in batches and updating your project throughout the year.
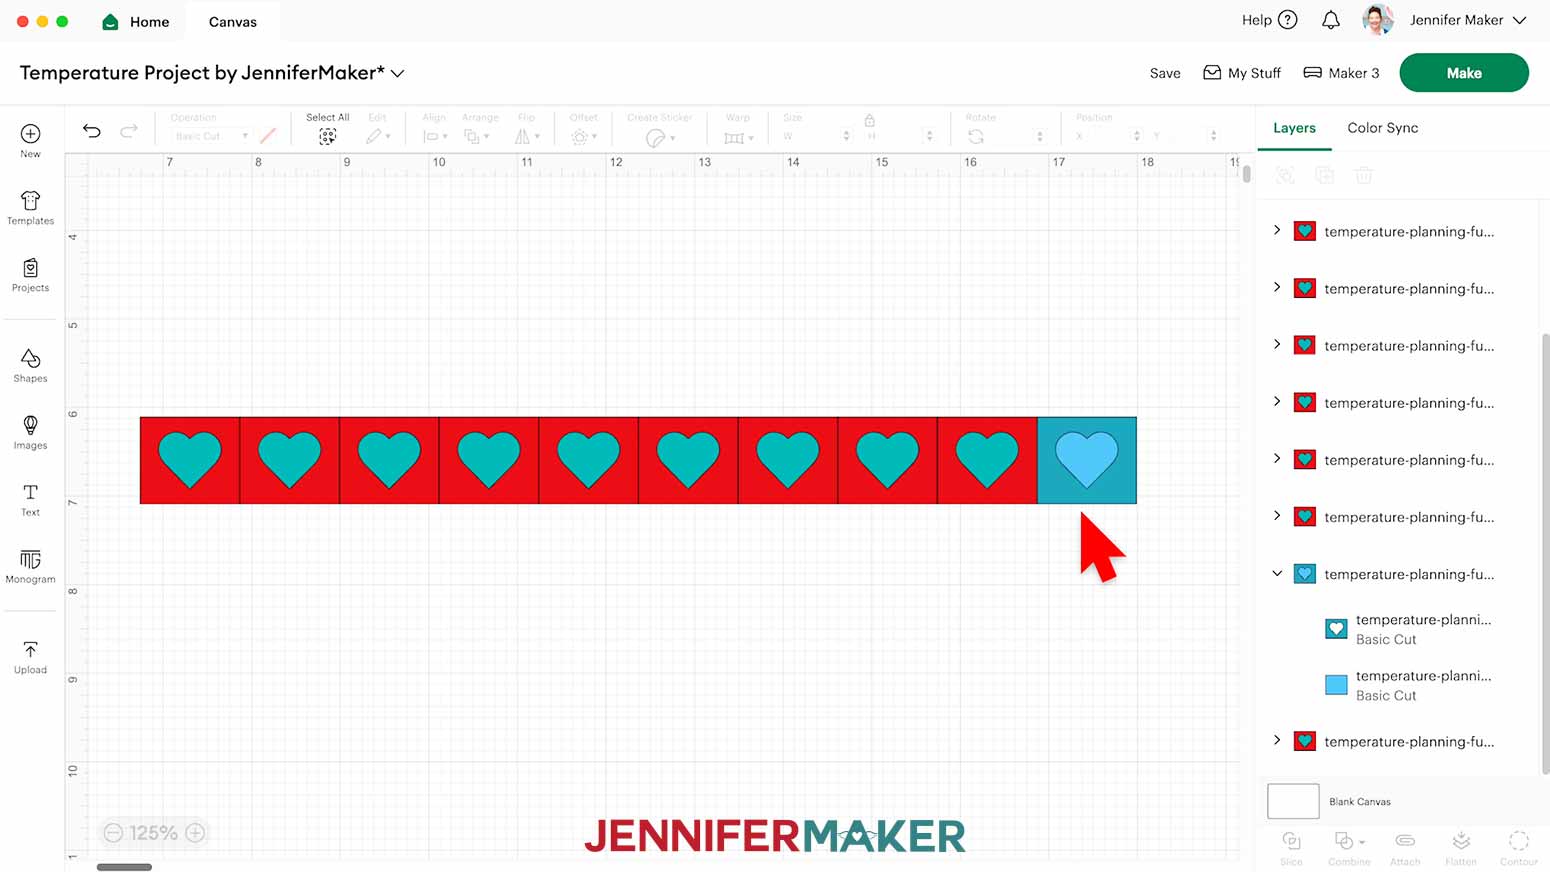
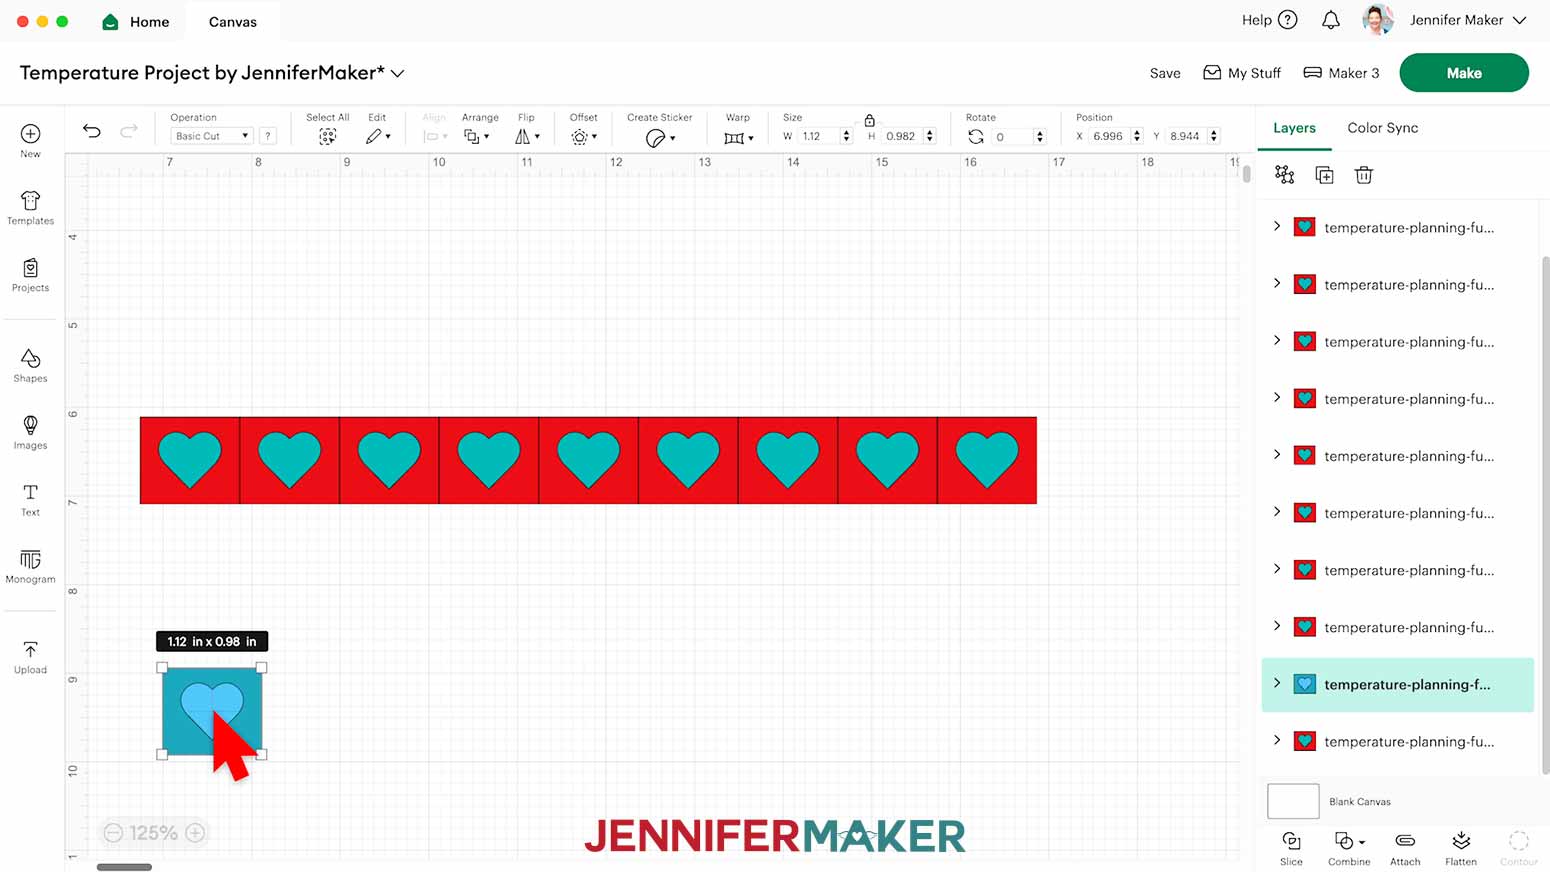
- Select the number of squares on the Canvas that matches the number of days you need squares for, then drag them to the side.
- Group the remaining squares.
- Rename the group of remaining squares “Rest of the Year.”
- Click the eye icon to hide the “Rest of the Year” group so they won’t be cut on this batch.
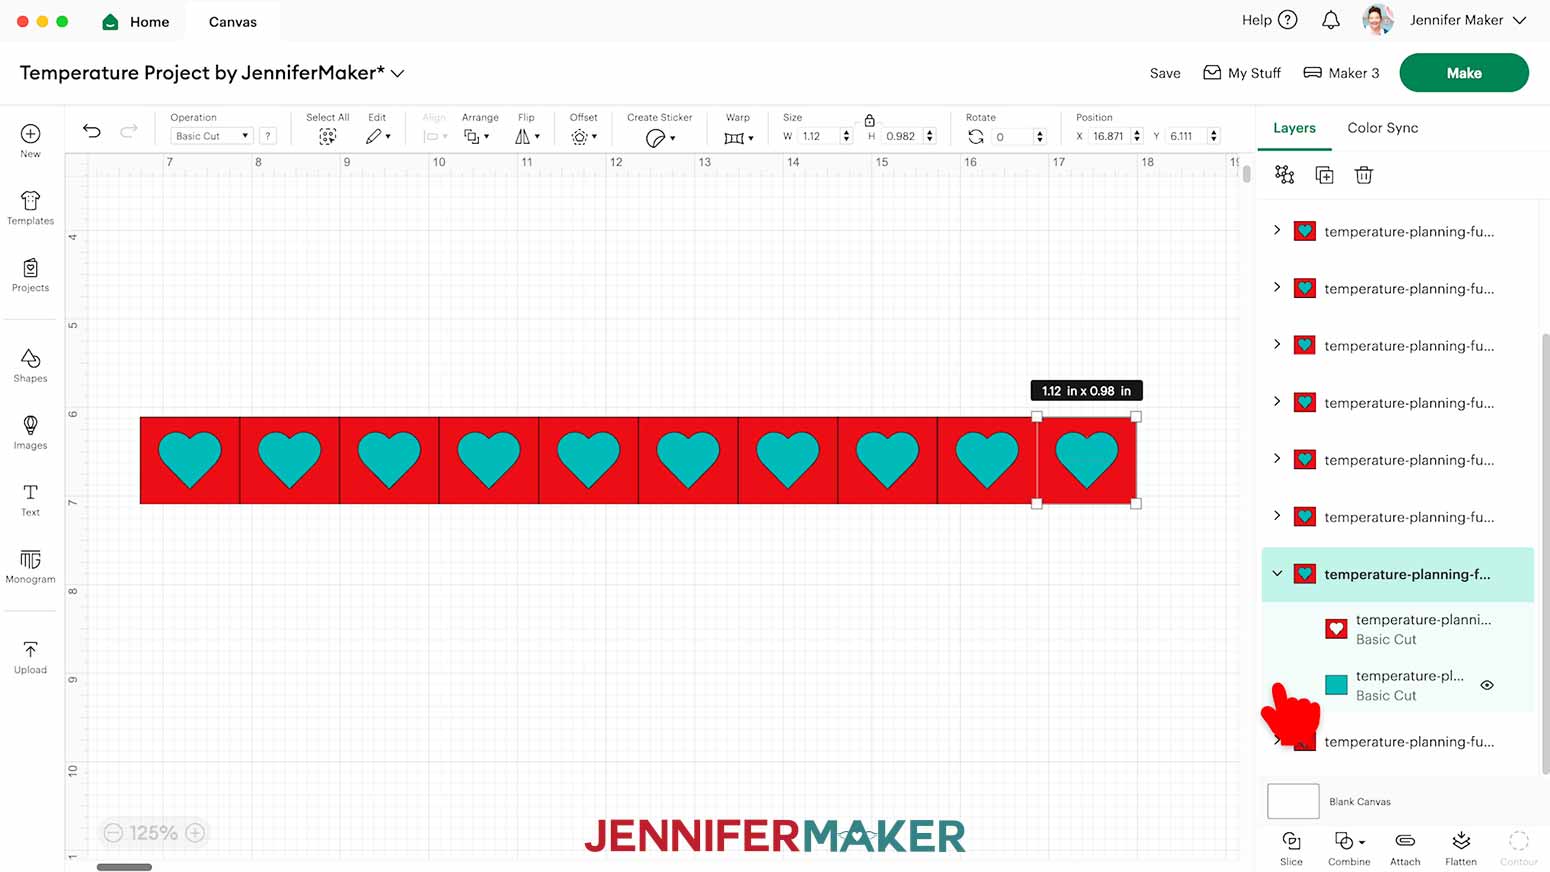
NOTE: When you’re ready to cut another batch of squares, open this project in Cricut Design Space and follow the same steps to prepare more. - Select one square.
- In the Layers Panel, click the arrow next to the square to expand the two layers.
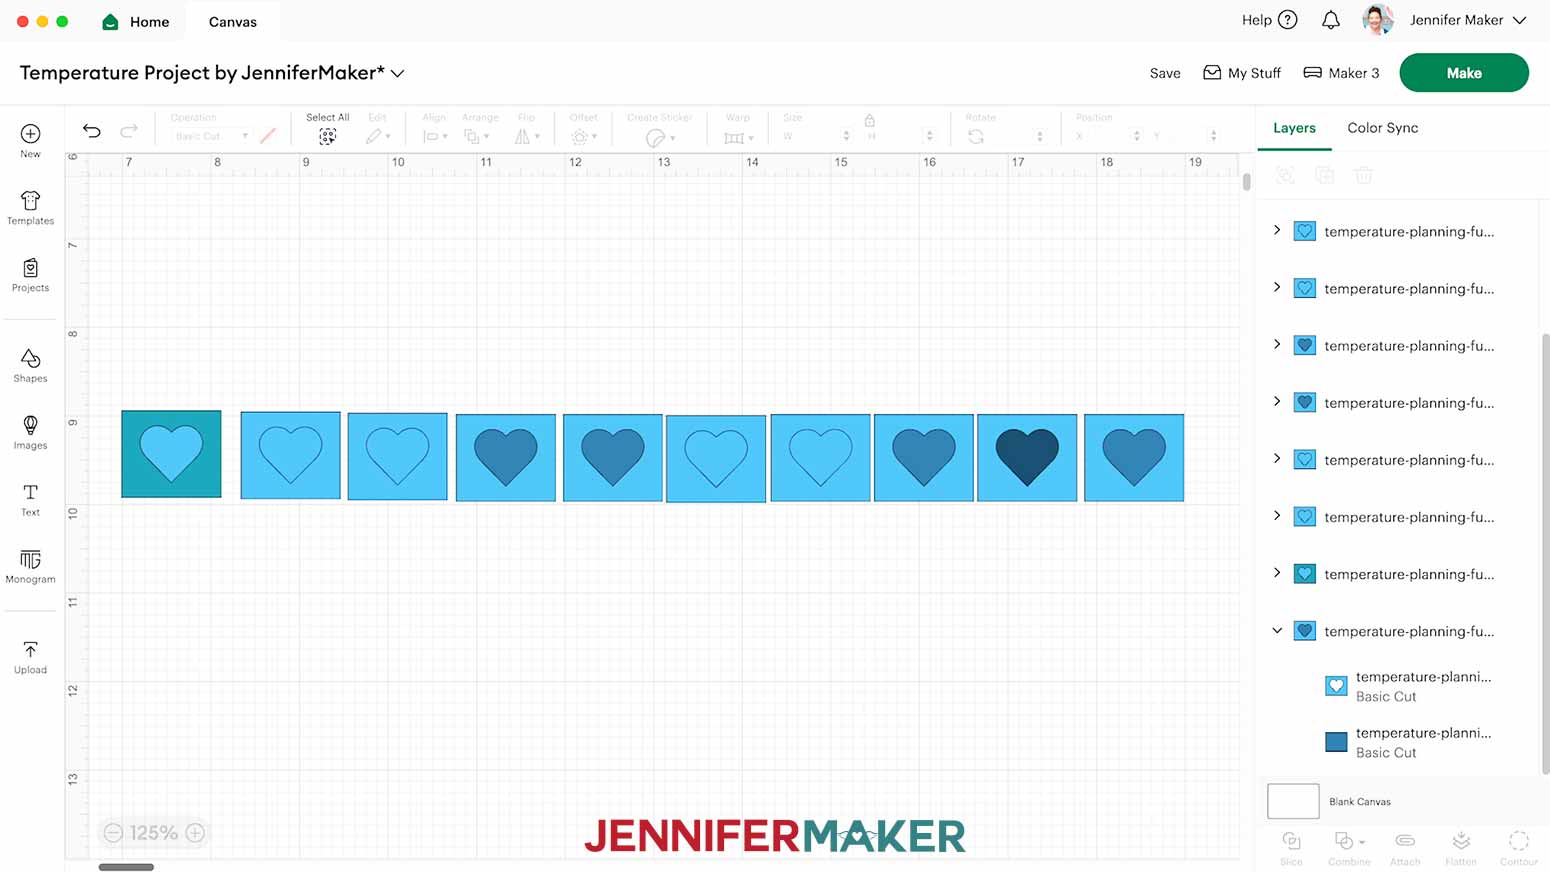
- Using your Temperature Color Chart for reference, use the Color Box at the top to change the colors of each layer to reflect your chosen colors for the High and Low temperatures for each day. Remember to stay consistent when selecting which layer represents the High and which represents the Low.
NOTE: When using the same colored materials for multiple days worth of squares in one cutting session, be sure to choose the same exact shade of that color so the right number of pieces cut on the right mats.
TIP: If you’re cutting a lot of squares at once, drag each completed one down to the bottom of the Canvas to help stay organized. - When you are finished changing the colors of all of the squares on the Canvas, group them.
- Right click on the group in the Layers Panel and rename it to reflect the dates they represent.
CUTTING
- Make sure the correct machine is selected.
- Click “Make” in the upper right corner of the screen.
- On the Prepare screen, make sure that “On Mat” is selected.
- Set your Material Sizes to match your materials, if needed.
- Click “Continue.”
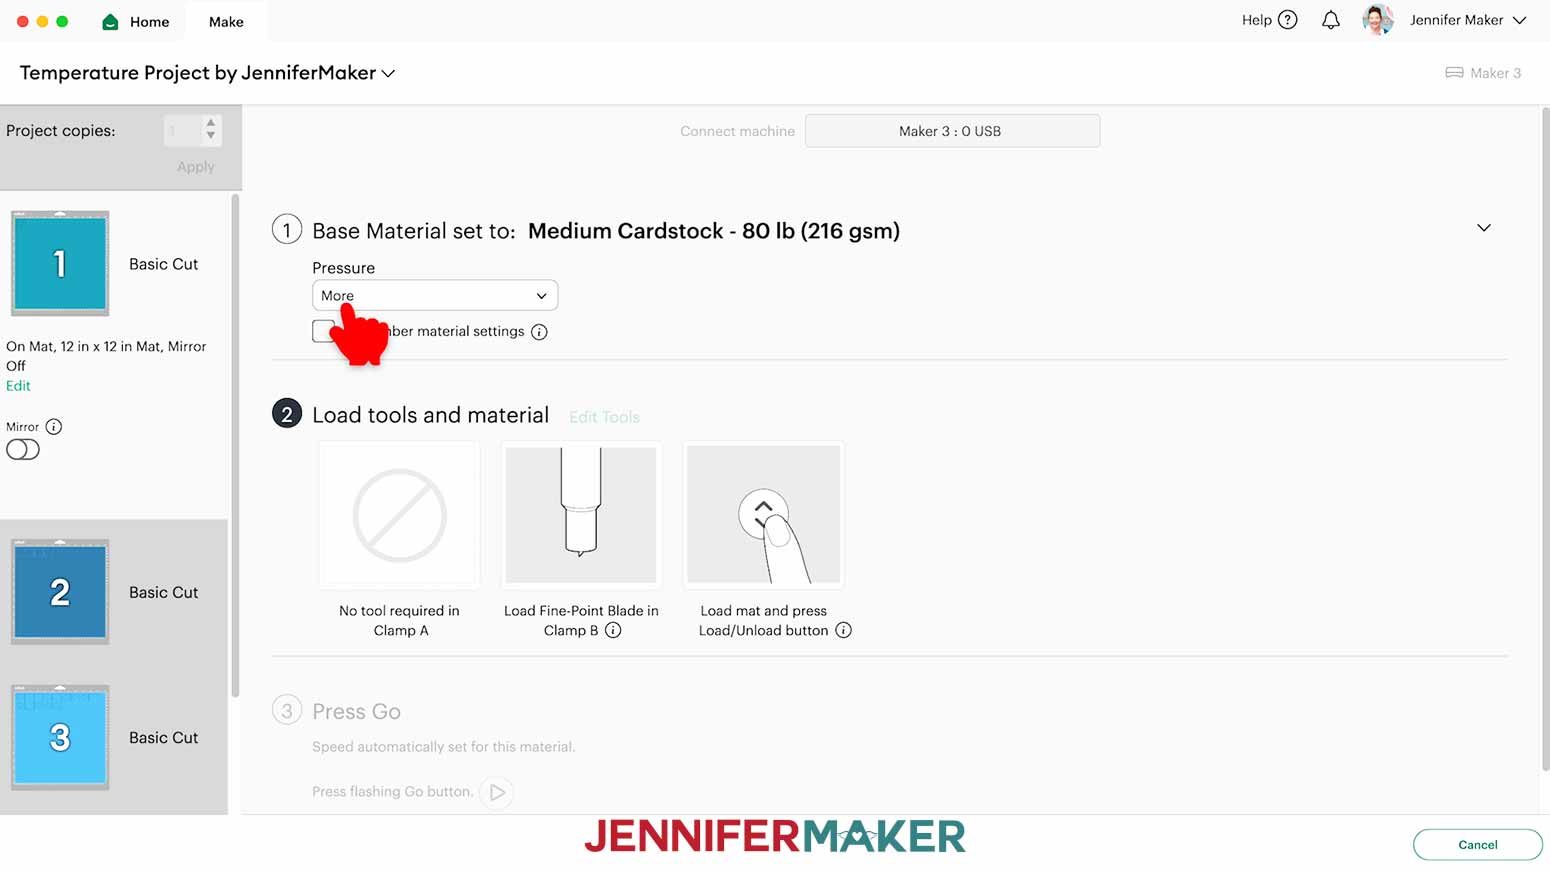
- On the Make screen, I used the “Medium Cardstock - 80 lb (216 gsm)” setting with “More” Pressure for all of my mats.
- Place your first mat’s material face up on a green StandardGrip machine mat so it covers the design area on the screen.
NOTE: Make sure to load the correct color and material to match your screen. - Use your brayer to smooth the sheet down and make sure it’s adhered well.
- Make sure your Premium Fine Point Blade is clean and in the correct clamp.
- Insert your prepared mat into your cutting machine so it matches the screen’s orientation, and press the flashing button to load it.
- Press the flashing middle button to begin the cuts.
- When it has finished cutting, don’t unload the mat just yet. Instead, gently lift a corner of the design to see if the cut went all the way through the sheet in the correct spots.
- If it’s not cut through, smooth the material back down and press the middle button again so your Cricut can go back over the cuts one more time.
- When the cut is finished, press the flashing button to unload the mat.
- Flip your mat over and peel it away from the material.
TIP: Save the leftover cardstock heart shapes for confetti, or use them as material samples on your Temperature Color Chart. - Repeat steps 7-15 for the other mats.

STEP 6: ASSEMBLE YOUR PAPER QUILT
- Use your Canvas in Cricut Design Space as reference to match up the layer pairs for each day.
- On one layer pair, turn the top layer over.
- Apply a small amount of craft glue to the back of the top layer. Avoid applying glue too close to the heart cutout.
- Adhere the glued top layer to the bottom layer. Make sure the edges align.
TIP: If you’re making a batch of squares, write the date on the back of each one as you go to keep track. - Remove the backing and glass from your frame. Place the glass somewhere safe until the year is over and your project is finished.
- Place the artboard inside of the frame.
- Replace the backing on the frame, then flip the frame over to the front. Make sure the frame is positioned horizontally, with the hanger at the top pointing away from you.
- Starting with January 1st, apply a small amount of craft glue to the back of the square.
- Press the glued square into place on the very top left of the inside of the frame. Be sure to align the edges of the square with the edges of the frame so the entire grid stays straight and aligned as you fill it in.
TIP: Reference your Temperature Tracking Chart as needed if any pieces move out of place. - Repeat steps 8-9 with the remaining squares. Align the edges of each subsequent square with the previous one you added to the board.
NOTE: Make new squares in batches to fill in the remainder of your board throughout the year.
TIP: The "full-year" file is very large and may cause Cricut Design Space to work slowly on your device. To save time, use the "heart" SVG to prepare and cut as few as one square at a time. If you resized your original full-year grid, open it on your Canvas and record the dimensions of one single square. Resize the single "heart" SVG to match those dimensions, then duplicate it as many times as needed for each batch of updates.


STEP 7: SHOW IT OFF
Here’s what my temperature tracking paper quilt looks like after my first batch of squares were added!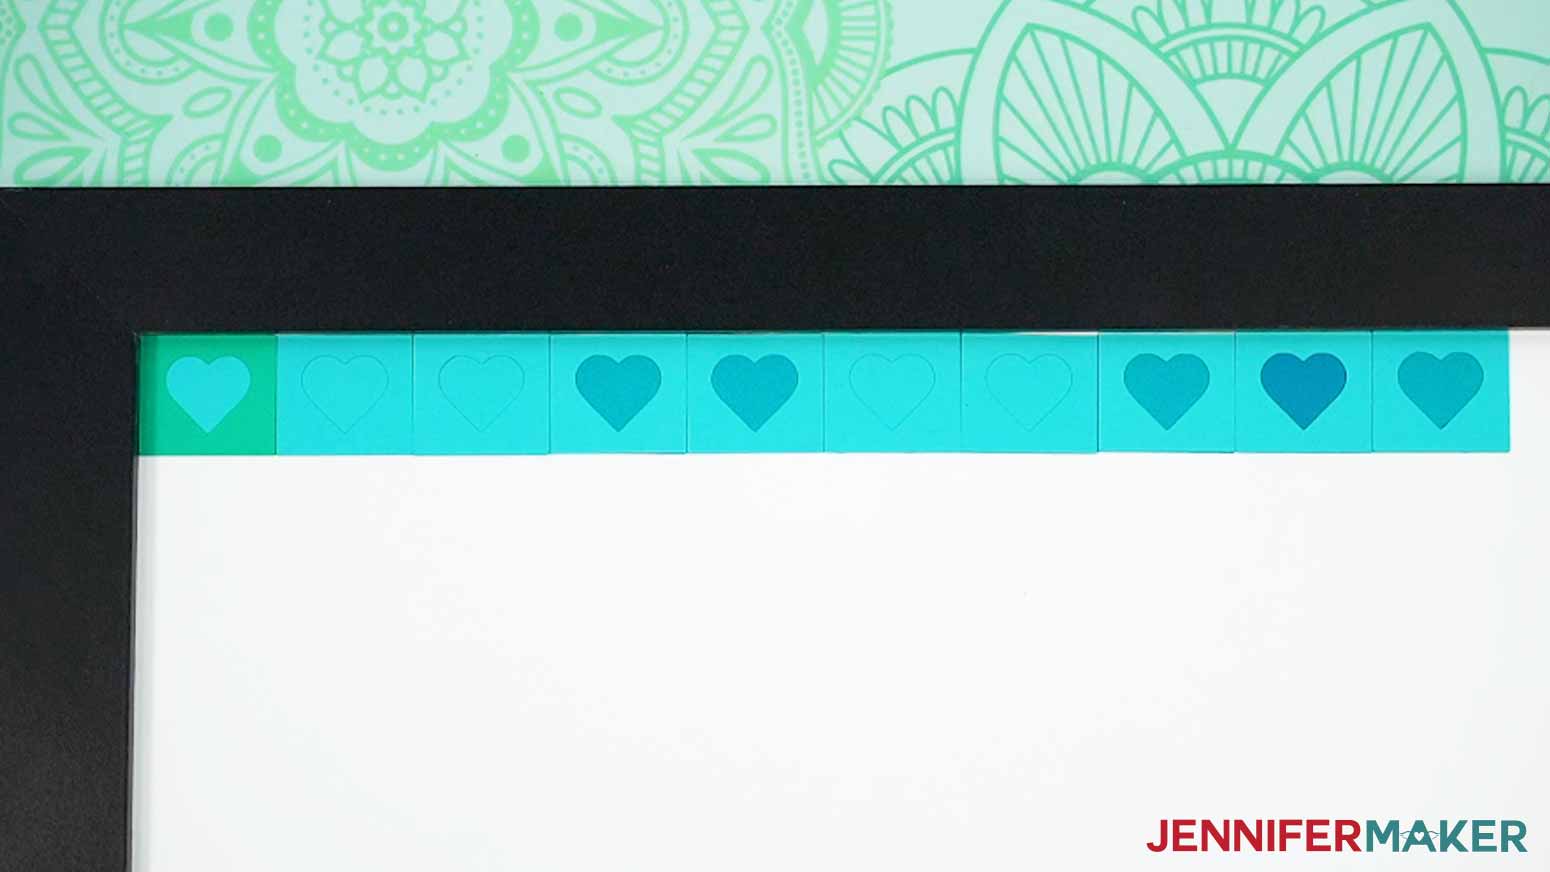
Follow this tutorial to prepare and add more pieces of data to your temperature tracking project throughout the year!
Notes
Finished Sizes:
365 Day Artboard (without frame): 18” x 24”
365 Day Artboard (with frame): 20” x 26”
Answers to Your Questions About How to Plan a Temperature Project
Q: I want to make a temperature project with fewer days and different square designs. How do I do that?
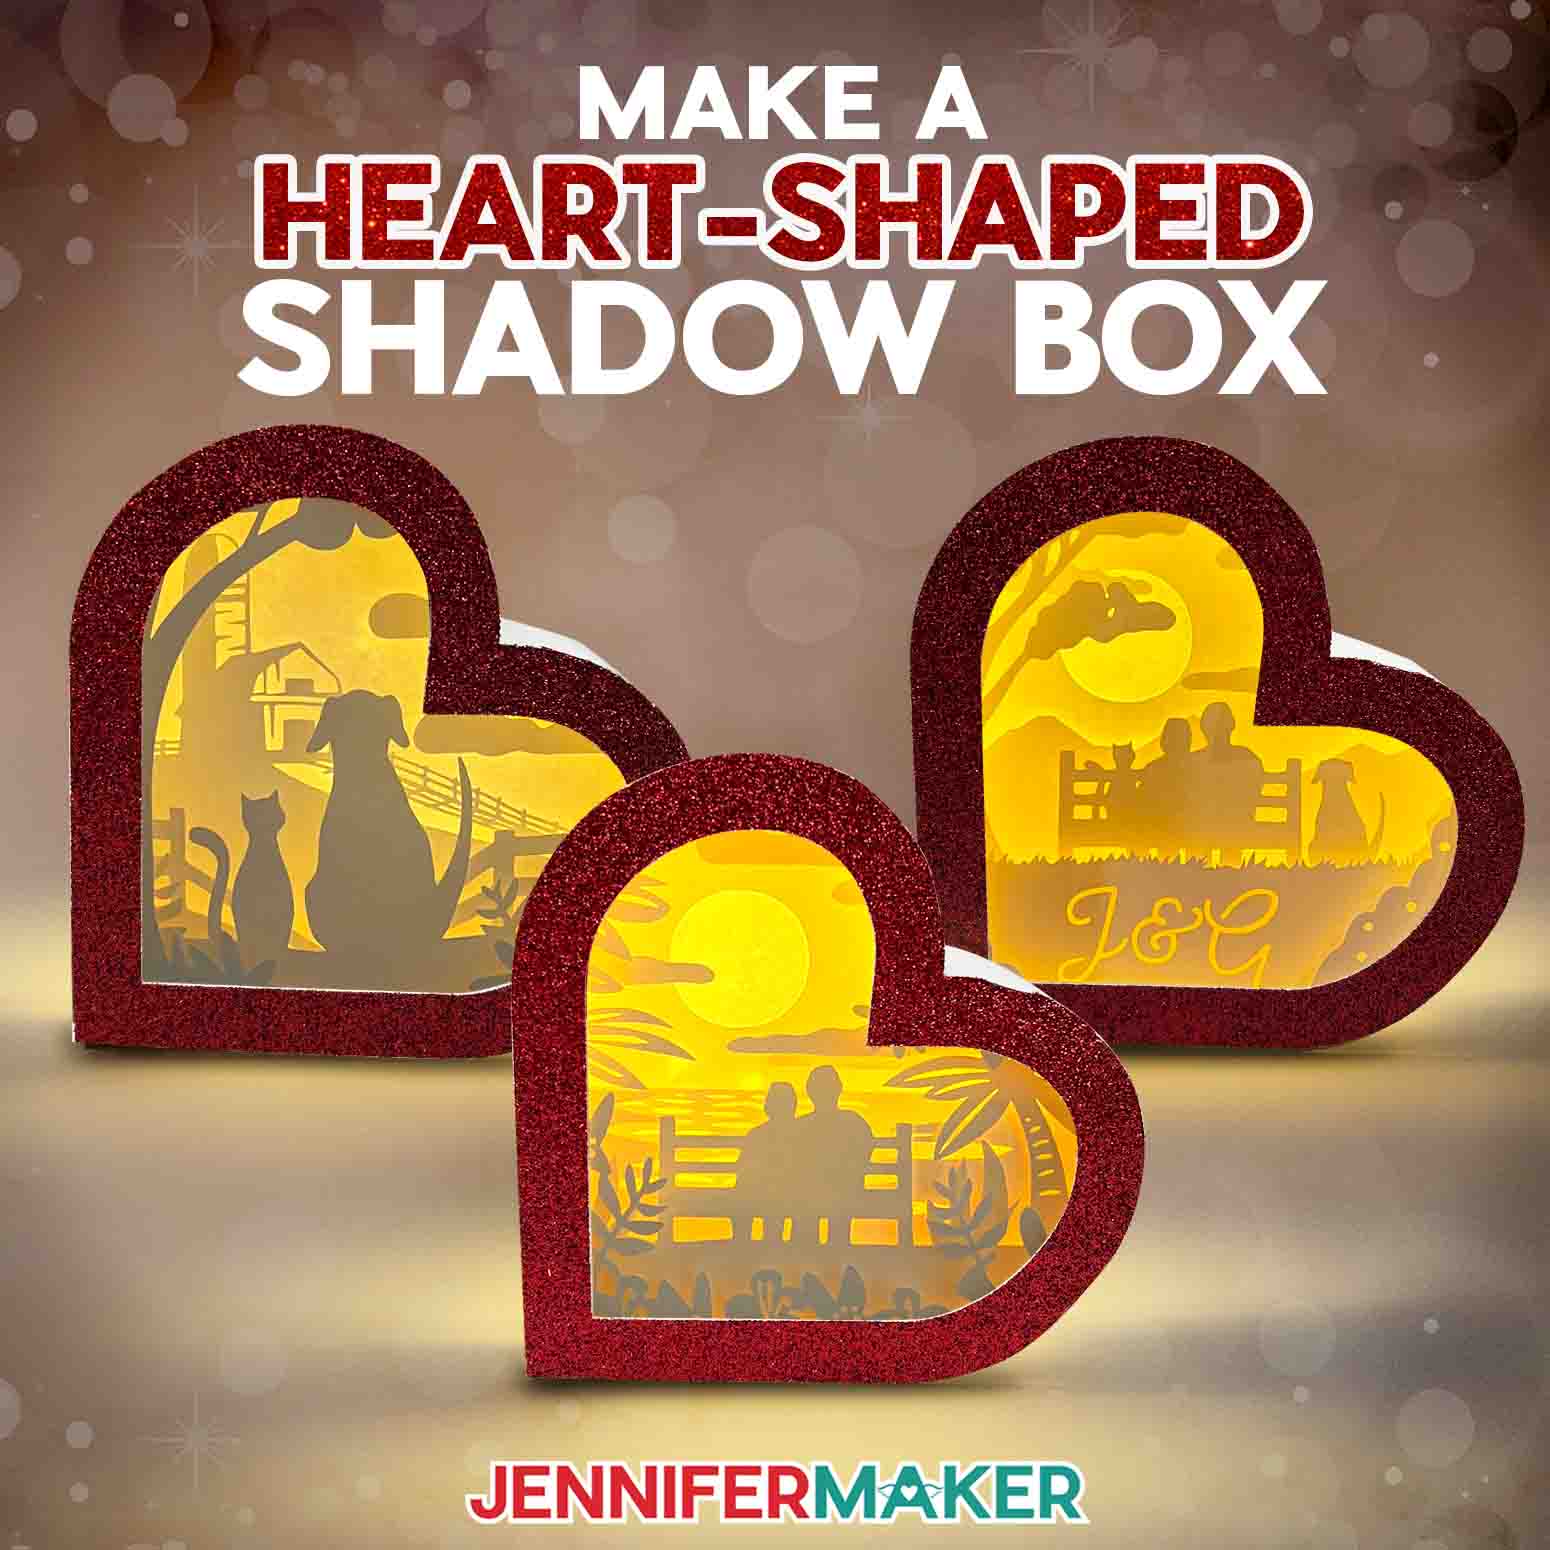
A: You can learn how to make a “Season Beginnings” shadow box with eight exclusive square designs in my ADVANCE program. Learn more about ADVANCE here!

Q: How do you make a temperature project?
A: Before you start your temperature project, it’s important to create your plan. Watch my tutorial video on how to plan a temperature project, and I’ll teach you how to use my free printable tracking sheets to plan and create your own unique temperature tracking craft using any medium!
Q: How many colors do you need for a temperature project?
A: The number of colors you choose for your project depends on the amount of color variation you want in the final result. For example, if you’re making a temperature blanket knitting project with different yarn colors to represent the temperature ranges, first decide how many rows you want to knit. Do you want a huge blanket to represent multiple pieces of data per day for the whole year? Or maybe a smaller blanket to only use each day’s average temperature? It’s up to you! After that, you can figure out your temperature ranges based on your area’s typical range across an entire year. For example, Maker Farm experiences temperatures below zero in the winter and over 90 in the summer. I wanted to use about eleven colors in my paper quilt project, so I divided my temperature range into eleven increments.
Q: Can a beginner make a temperature project?
A: Yes! One fun thing about temperature projects is that you can make them as simple or as complex as you want. Whether you’re making a simple cardstock temperature craft or something more complex like a temperature scarf or quilt, my free tracker files can help you plan and execute your project!
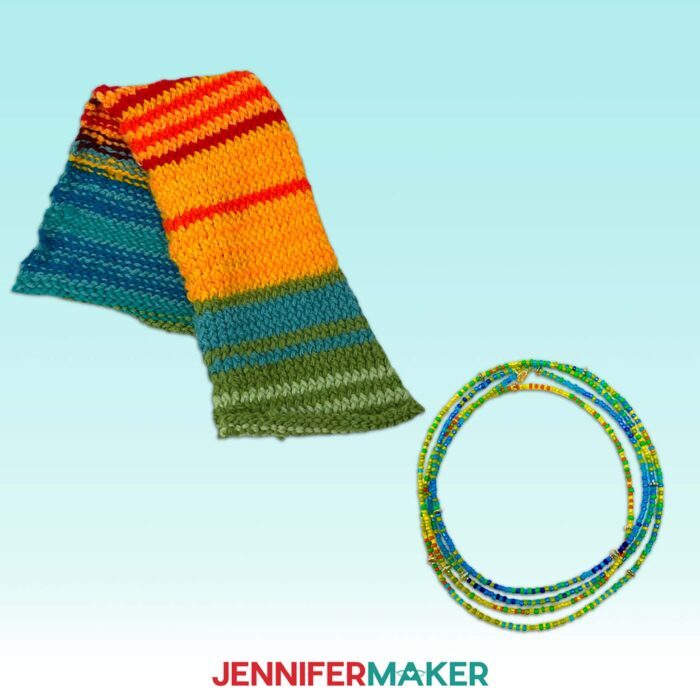
Q: I want to make the scarf, quilt, or necklace — what materials did you use?
A: To make the scarf, I used this Big Twist acrylic yarn and these yarn needles. For the quilt, I used this Robert Kaufman fabric sampler. On the necklace, I used these 3mm glass seed beads in yellow, red, orange, green, and blue — as well as these silver-toned spacer beads to mark the months.
Q: Can you show me how to keep track of a temperature project?
A: The color and temperature tracker PDF files in my free download are the perfect place to start in planning and tracking your temperature project. I explain how to use them in my video tutorial, as well as my written tutorial with photos above.
Q: Help! My Cricut Design Space screen looks different than yours!
A: If you’re using the latest version of Cricut Design Space, your screen may have slight variations than the screen you see on the video tutorial. Good news: All of the same functions are there, they may just be in different spots or have new icons. Pause the video if you need, or follow along with the written tutorial. If you get stuck, ask for expert support in our Facebook group. Our group is a fun and friendly place to share your projects, ask questions, and find inspiration! Plus, you can catch the latest news on JenniferMaker projects, files, tutorials and more.
Q: Can I make and sell my temperature tracking wall art?
A: I love supporting creative entrepreneurs! If you want to use my designs and projects for commercial use, please familiarize yourself with my important licensing information before selling your crafts.
I do not permit sale of my digital items, but you can sell the creative goods you make with them — as long as you follow my licensing requirements. That means you cannot sell the color and temperature tracking PDF files or the paper temperature quilt SVG files, but you can sell crafts that you made with the files within the guidelines linked above.
Q: How do I know if my design is the right size?
A: Not sure if your design is uploading at the correct size or aspect ratio? If you are using Cricut Design Space Beta for Desktop, try switching to the Live version as this has worked in our testing. Here are the dimensions you should see for each design on your Canvas:
-
temperature-planning-full-year-jennifermaker-SVG: 24” x 18”
-
temperature-planning-heart-jennifermaker-SVG: 2.47” x 1”
-
temperature-planning-shadowbox-jennifermaker-SVG: 10” x 10”
-
temperature-planning-toolkit-jennifermaker-SVG: 4.86” x 2.17”
If you need help resizing your design, open my Resizing Guide in a new window.
Q: Can I resize the cardstock temperature project SVGs?
A: Yes, you can resize the SVGs in my free download for this project. I don’t recommend sizing them smaller because they will be very tiny and hard to work with, but you can size them up to fit a larger surface. Be sure to resize the entire grid to fit your surface before ungrouping it and preparing your square pairs to cut.
Q: Do you have other tracking projects I can make?
A: I have several projects designed to help you track data or get more organized. Check out a few of my favorites:
- Keep inventory of your craft stash with a Craft Inventory Binder
- Track important dates or habits on a Stacked Calendar
- Reference your pen and marker swatches with my Printable Swatch Chart
- Stay hydrated and keep track of your hydration with a DIY Water Tracker Bottle
- Track shopping lists, important dates, and more with a Family Command Center
- Record important thoughts, ideas, and data in a Debossed Leather Journal or Cutwork Leather Journal
- Keep your planner working for you with Cricut Planner Stickers and DIY Paper Clips
- Track your craft space accountability through my 30 Day Craft Room Organization Challenge
Get my free SVG/DXF/PDF files to plan a temperature project!
(If you do not see the signup form above, click here.)
I love seeing what you make with my designs and how you use them! Please share a photo of your unique temperature project in our Facebook group or tag me on social media with #jennifermaker.
Love,

Want to remember this? Save this Plan a Temperature Project tutorial to your favorite Pinterest Board!